Example EDA for team projects
Exploring the penguins dataset
Import data
Univariate distributions
Categorical variables
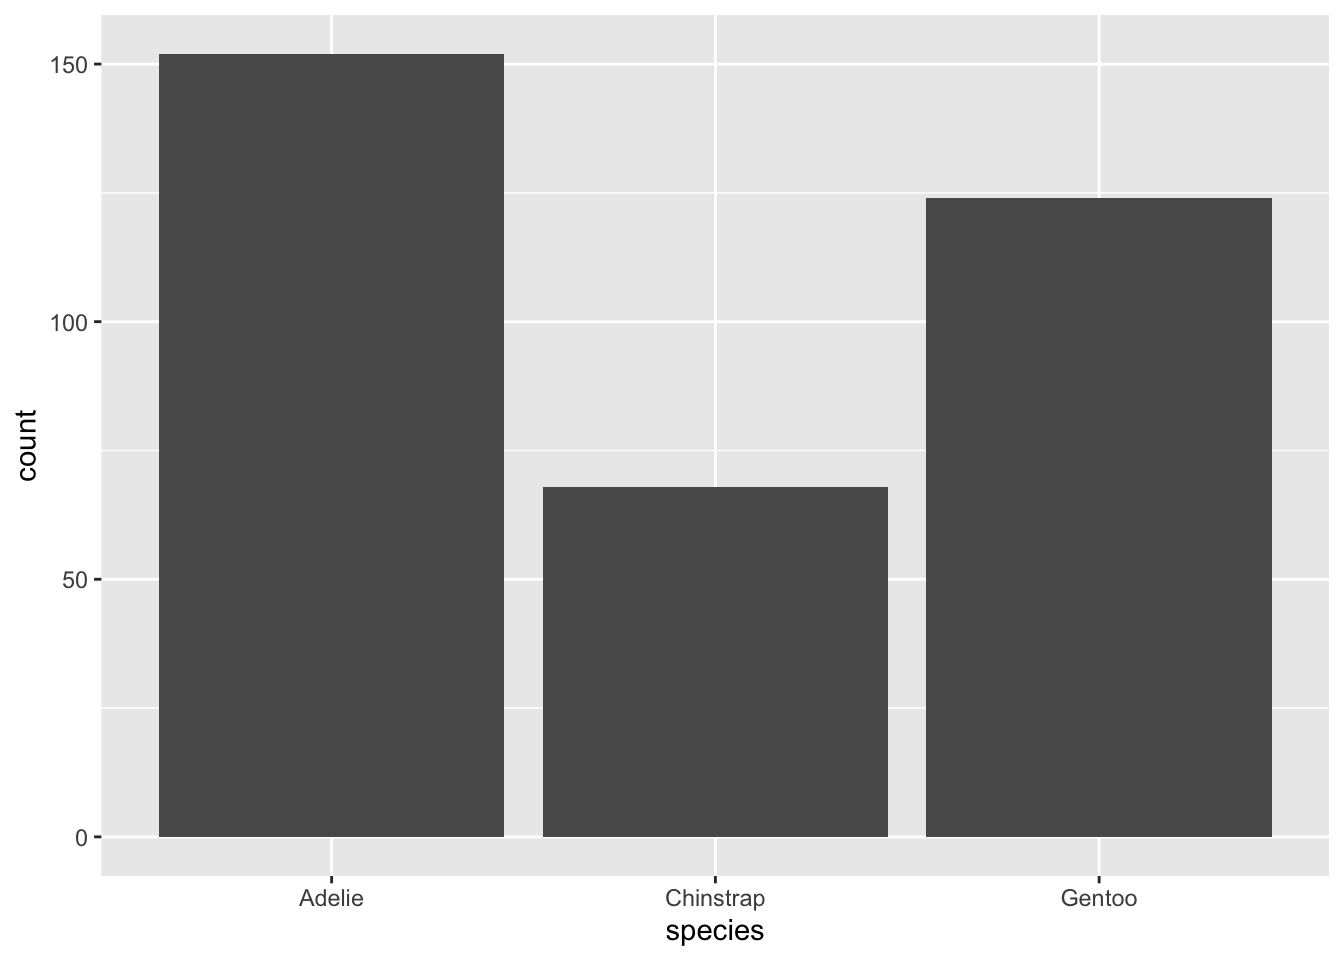
Species
- Three types
- Adelie most represented, followed by Gentoo and Chinstrap
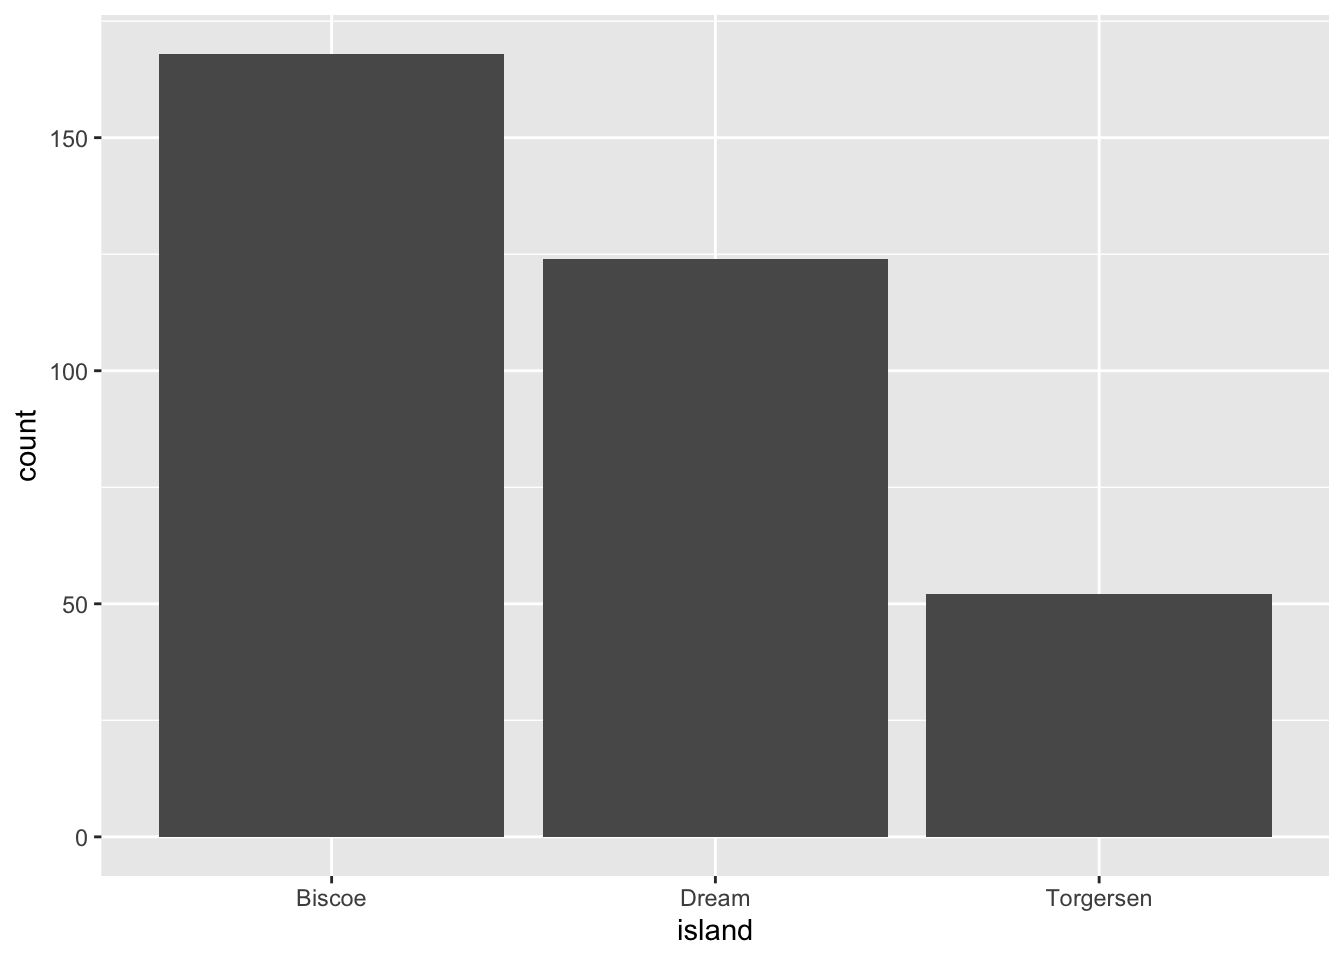
Island
- Biscoe most frequent, then Dream and Torgersen
- Any connection between species and island?
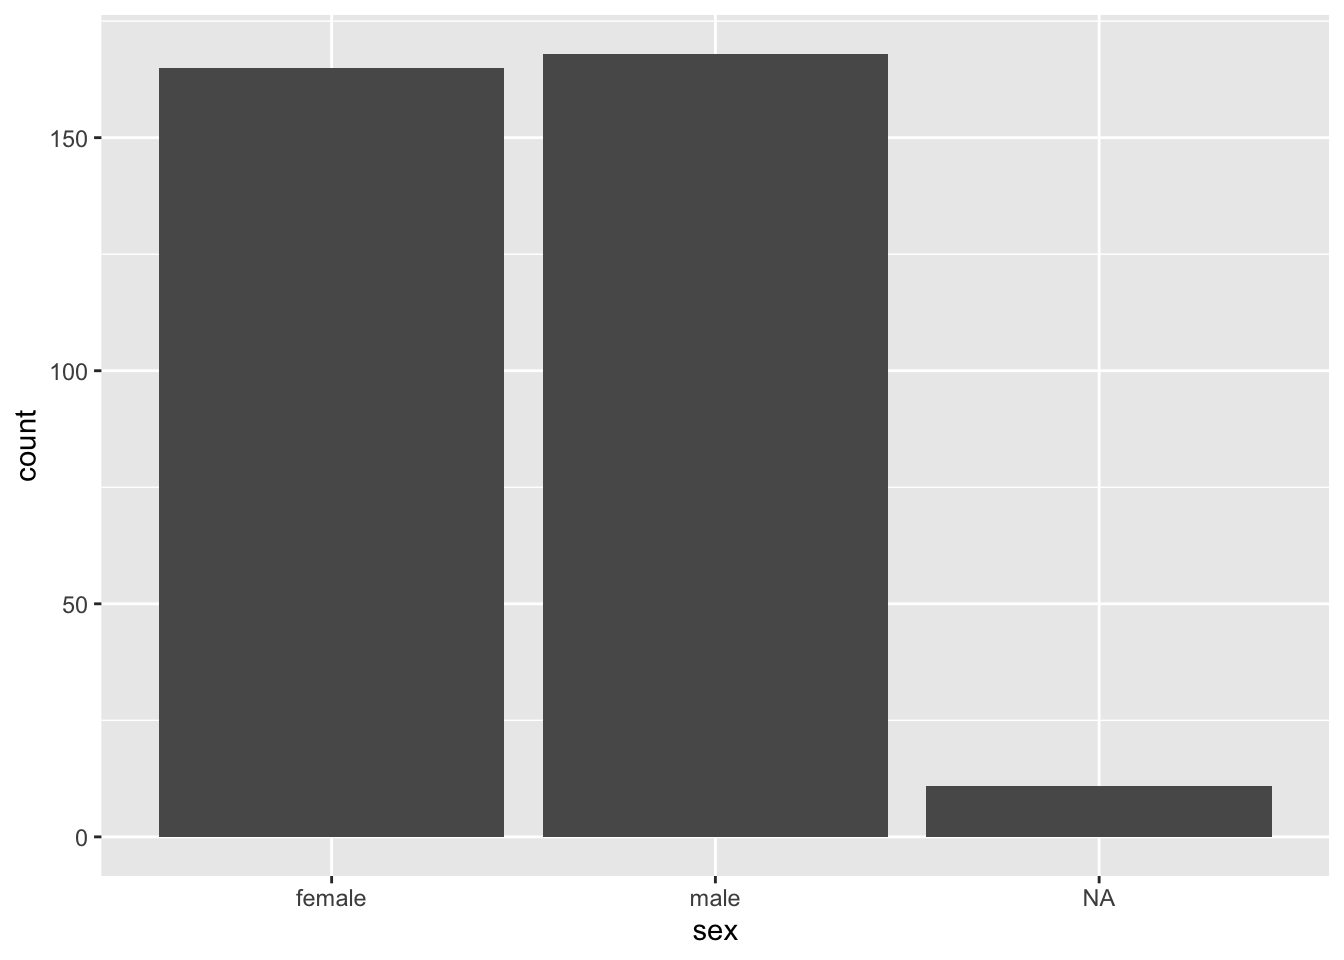
Sex
- Roughly equal number of males and females
- Some
NAvalues - what to do with those?
Continuous variables
ggplot(data = penguins, mapping = aes(x = bill_len)) +
  geom_histogram()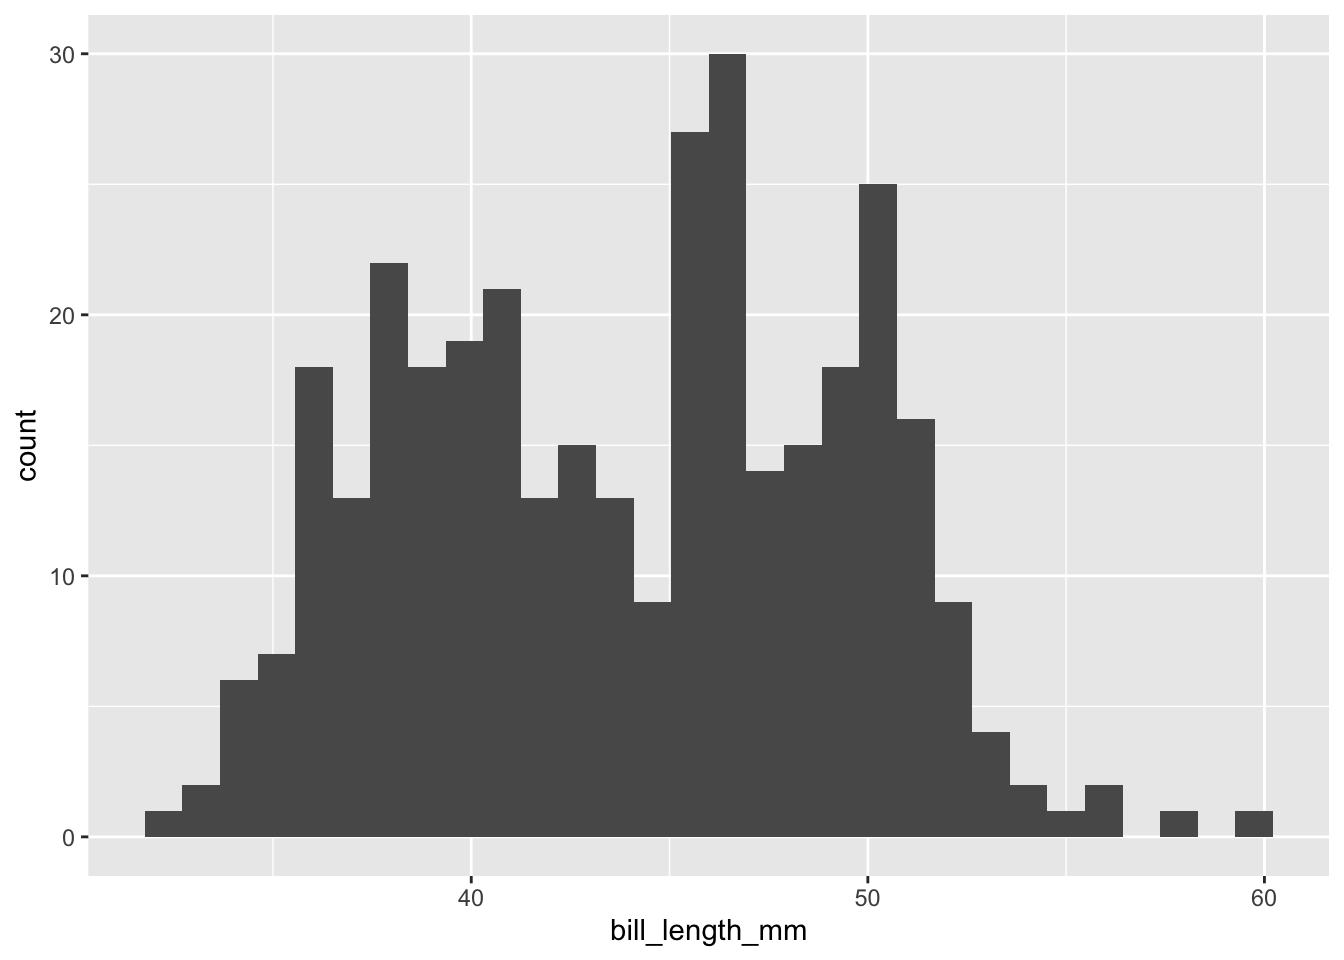
ggplot(data = penguins, mapping = aes(x = bill_len)) +
  geom_histogram(binwidth = 1)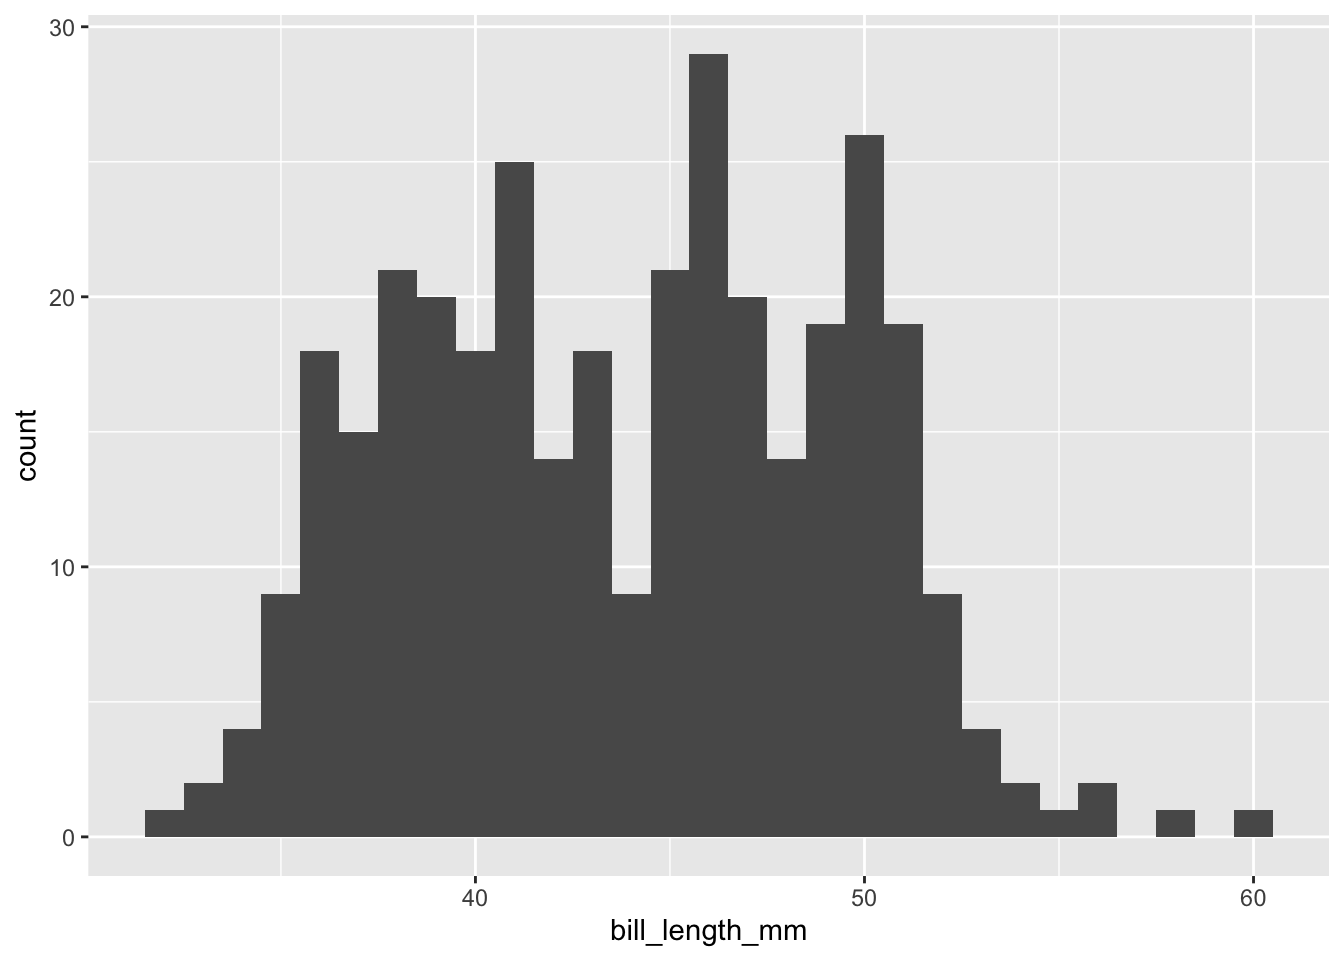
ggplot(data = penguins, mapping = aes(x = bill_dep)) +
  geom_histogram()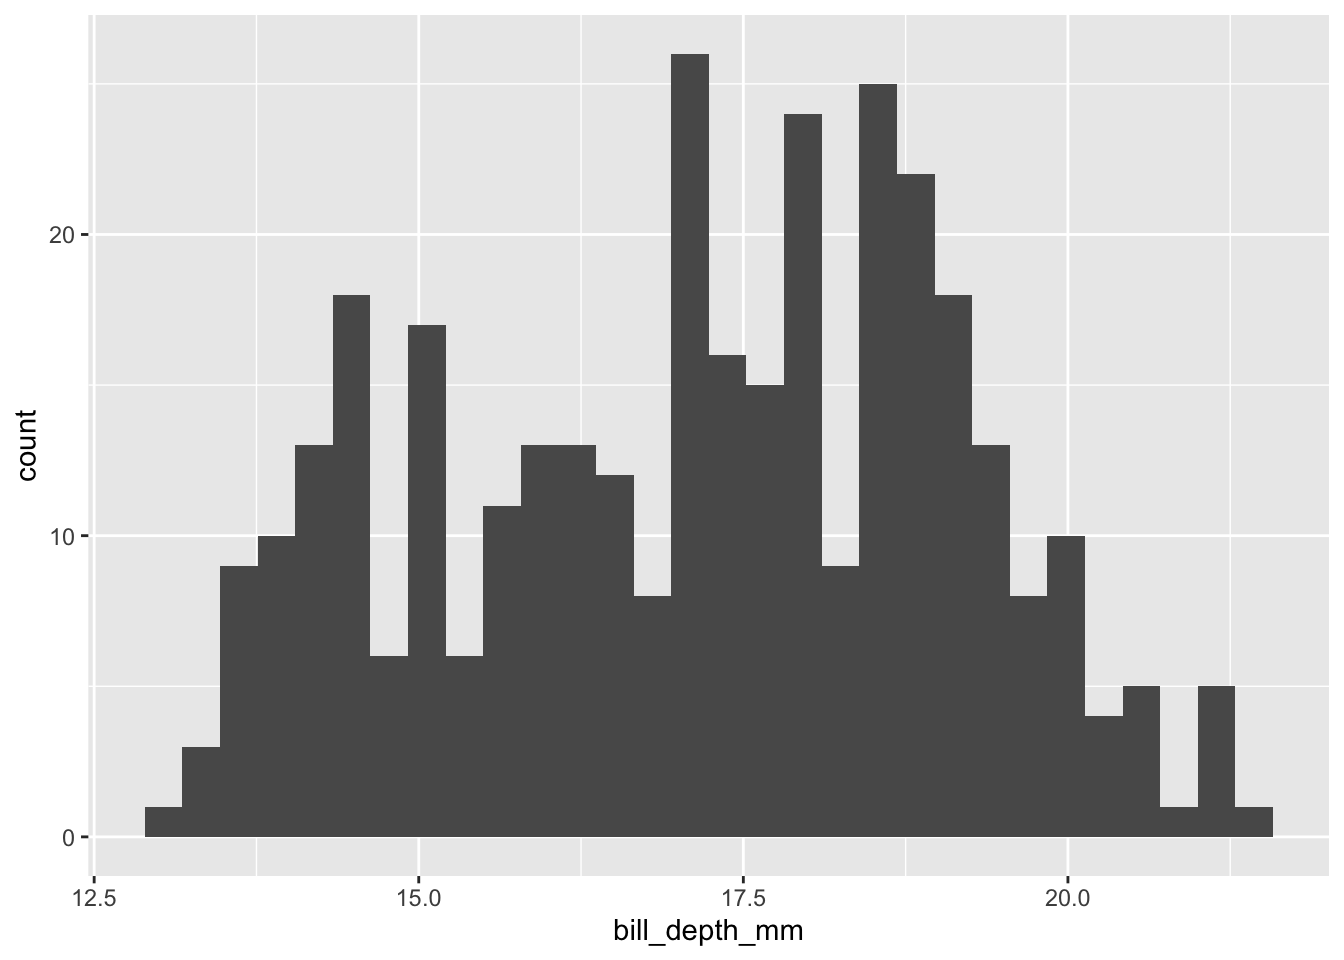
ggplot(data = penguins, mapping = aes(x = bill_dep)) +
  geom_histogram(binwidth = 0.5)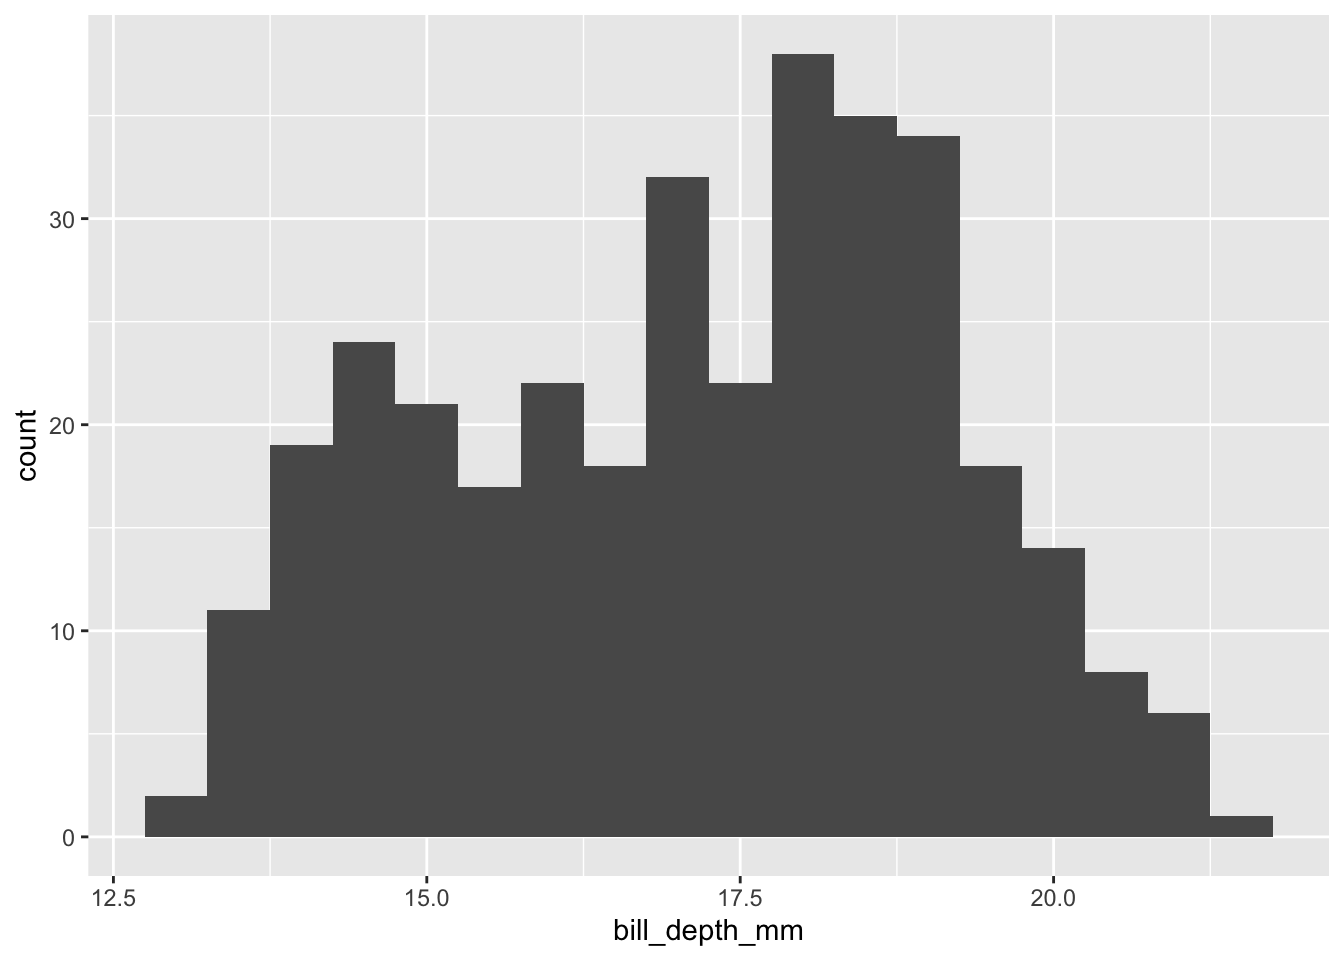
ggplot(data = penguins, mapping = aes(x = flipper_len)) +
  geom_histogram()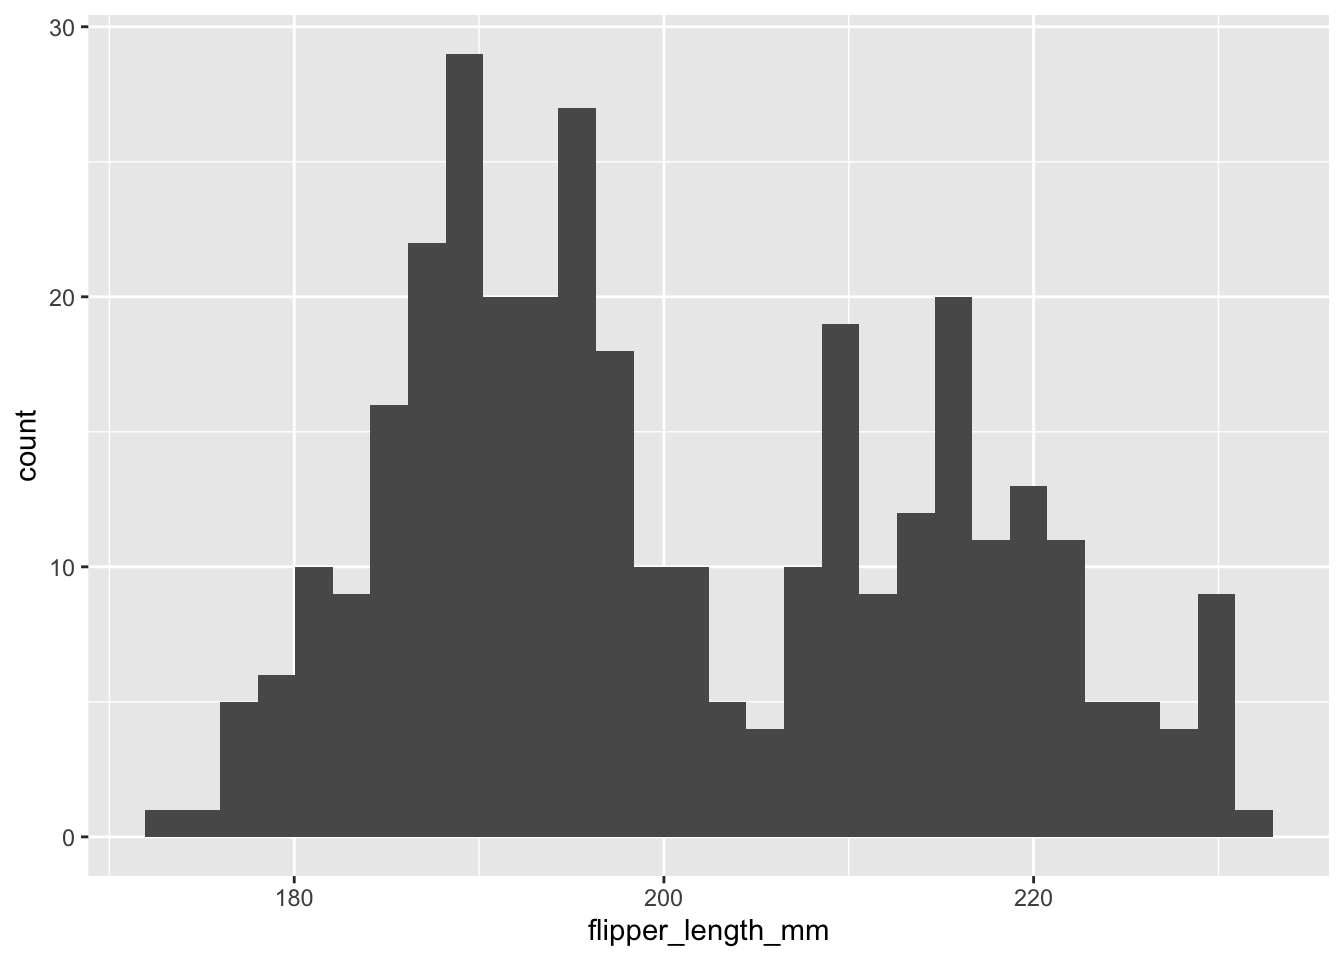
ggplot(data = penguins, mapping = aes(x = flipper_len)) +
  geom_histogram(binwidth = 2)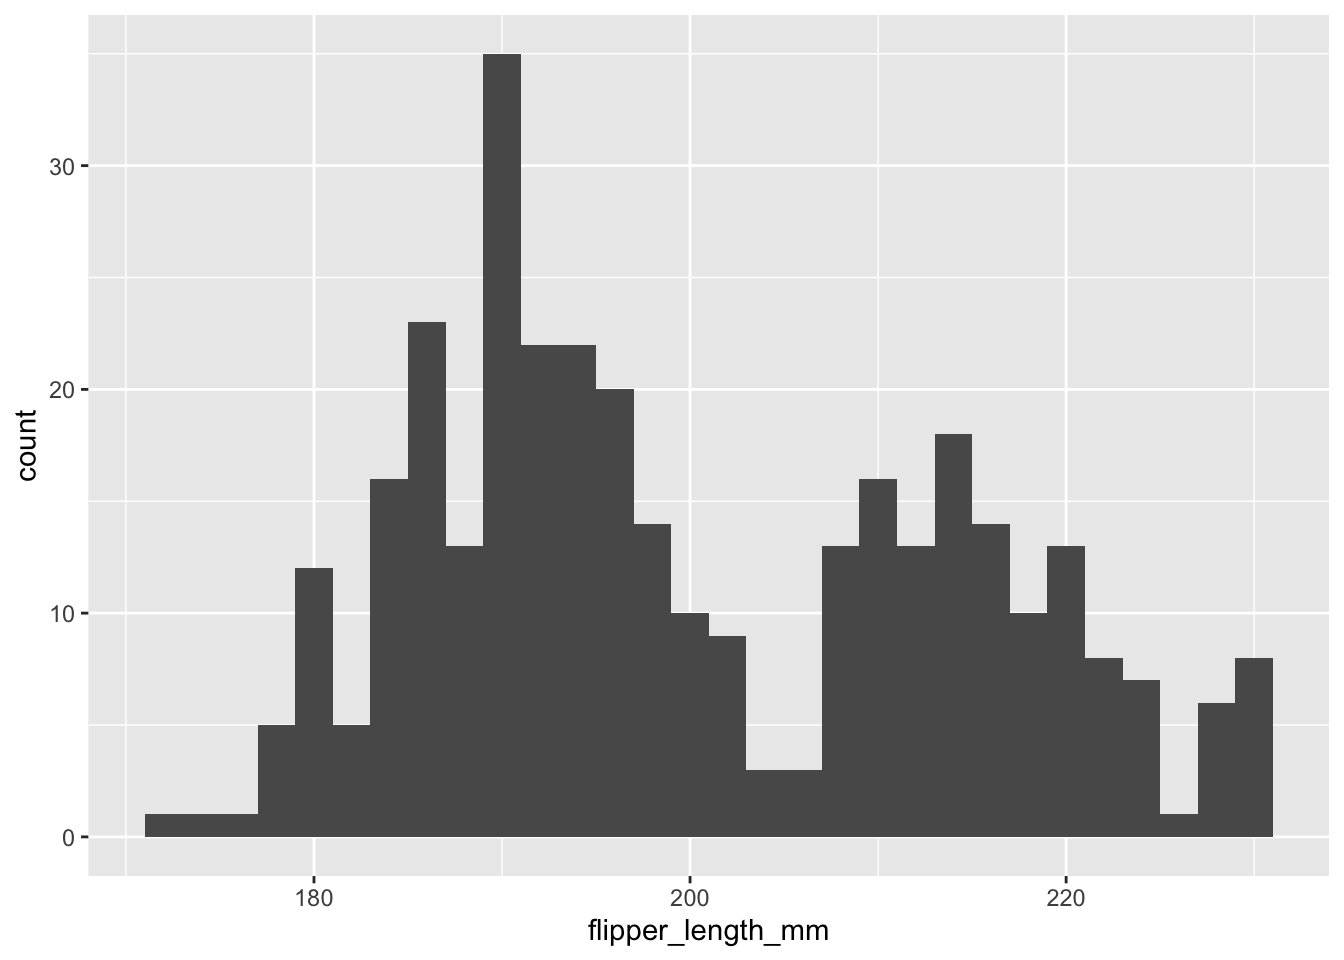
ggplot(data = penguins, mapping = aes(x = body_mass)) +
  geom_histogram()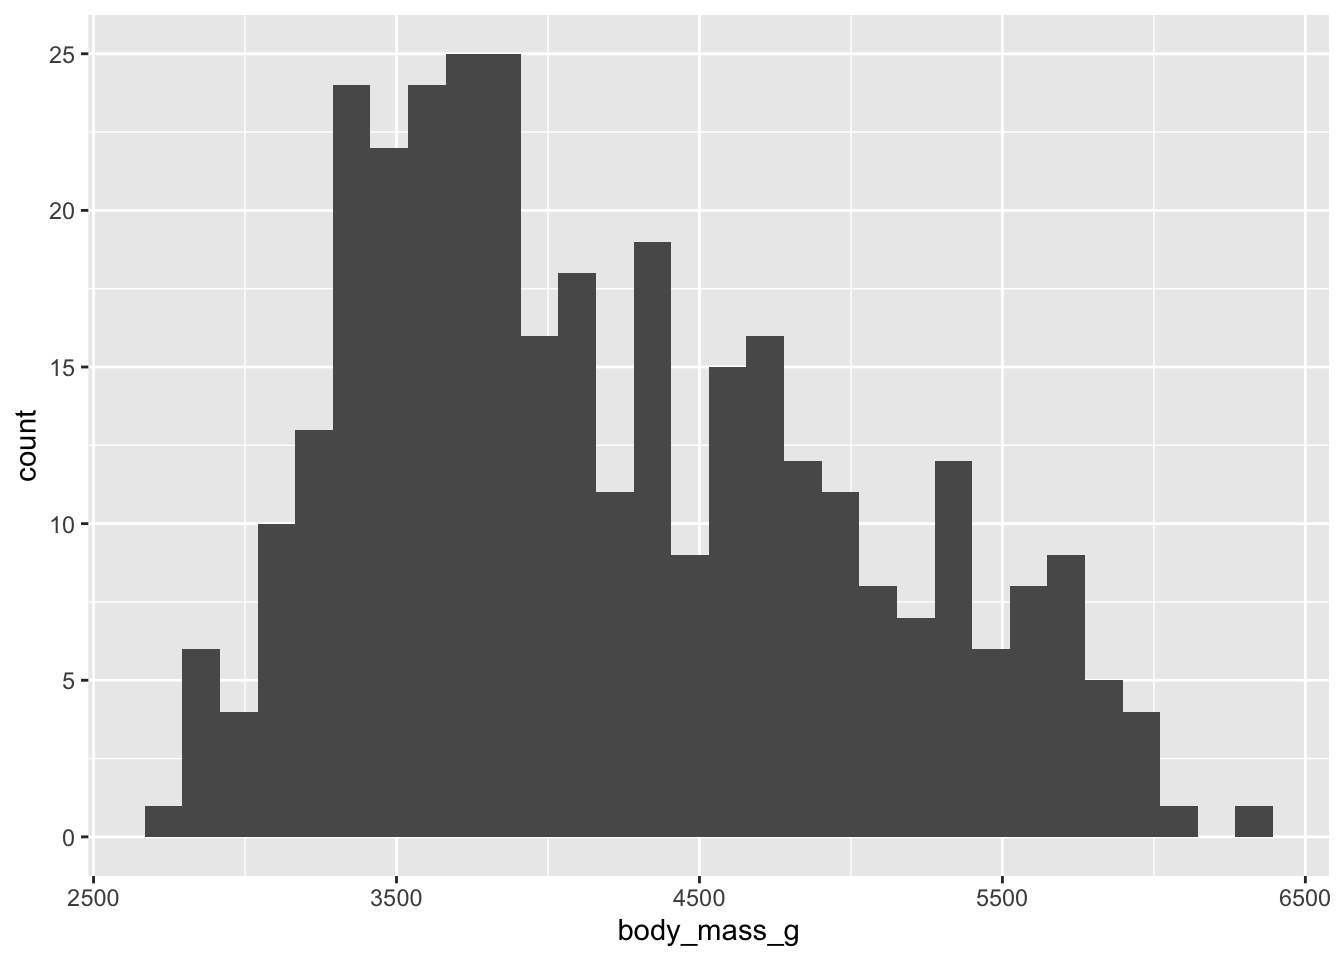
ggplot(data = penguins, mapping = aes(x = body_mass)) +
  geom_histogram(binwidth = 100)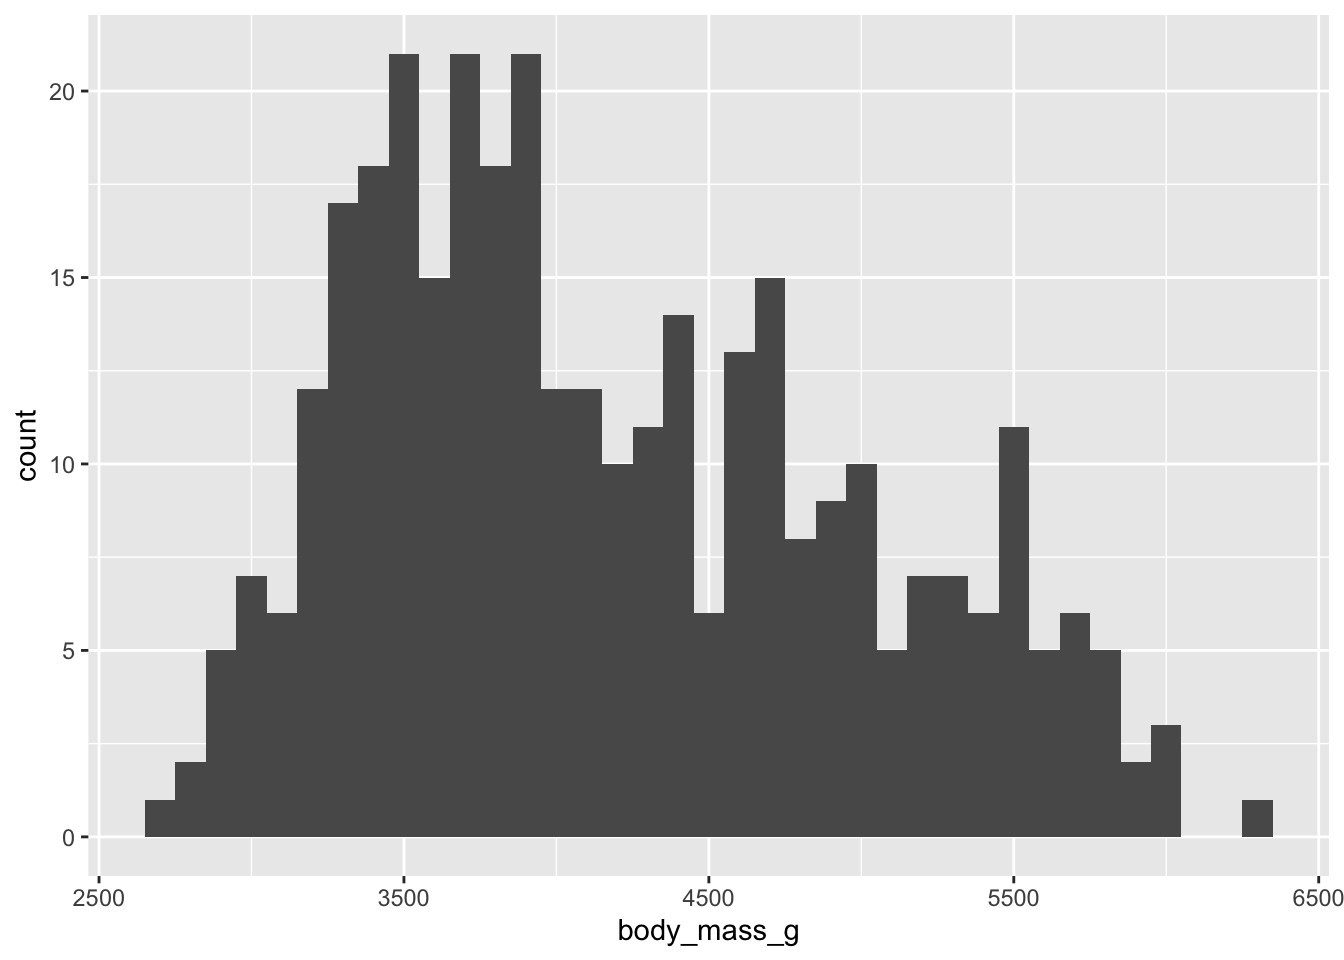
- Bill length - bimodal distribution, slightly long right-tail
- Bill depth - bimodal, but higher peak around 18 mm
- Flipper length - bimodal, much higher peak around 190 (unusually large number right at that value), smaller hump around 210
- Body mass - unimodal, right-skewed
Bivariate comparisons
Species and island
Three values each - any geographic trends where species are found?
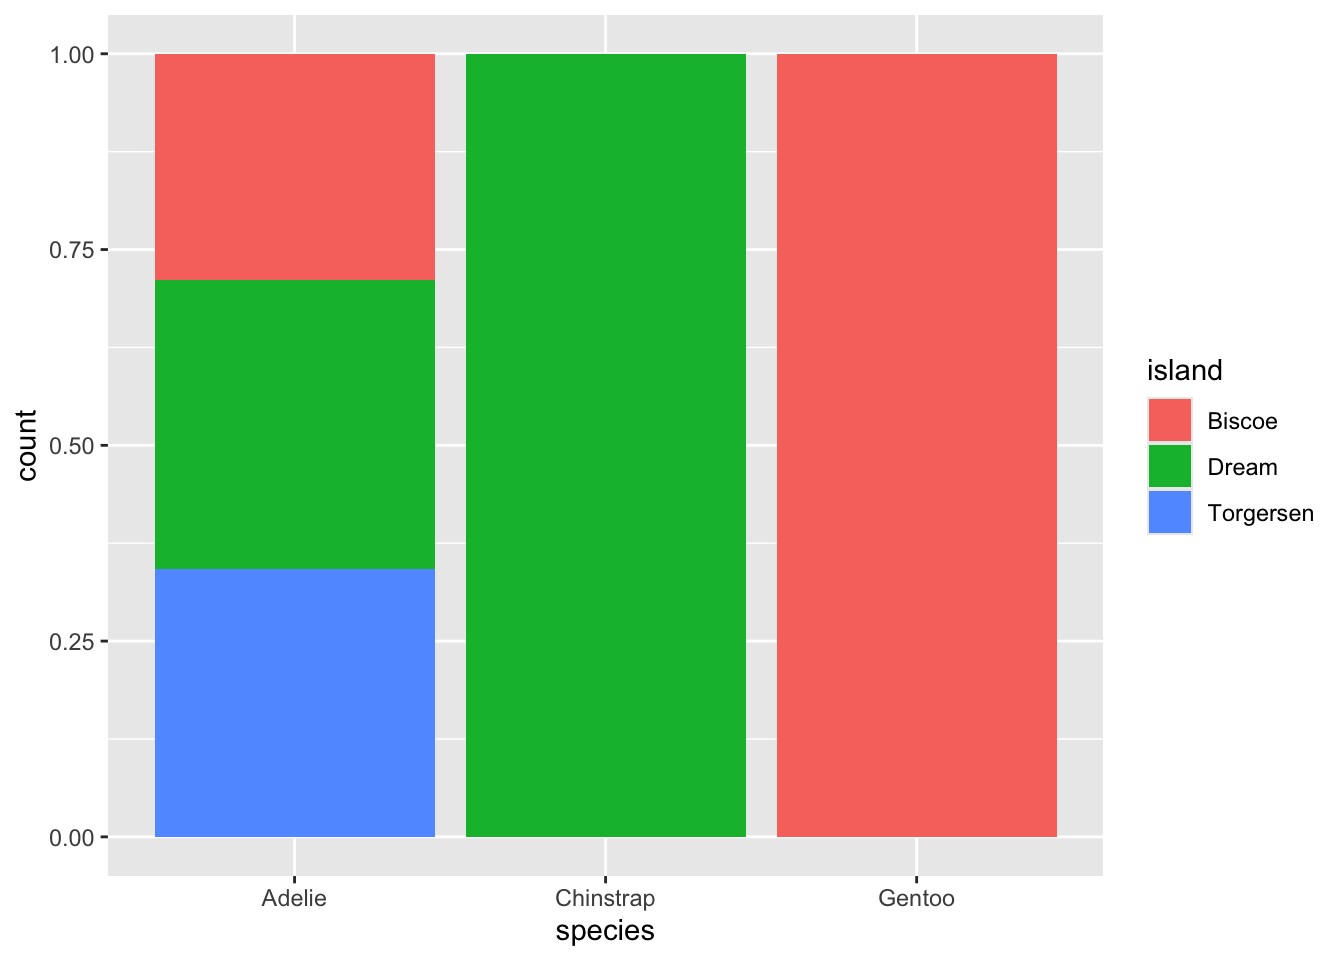
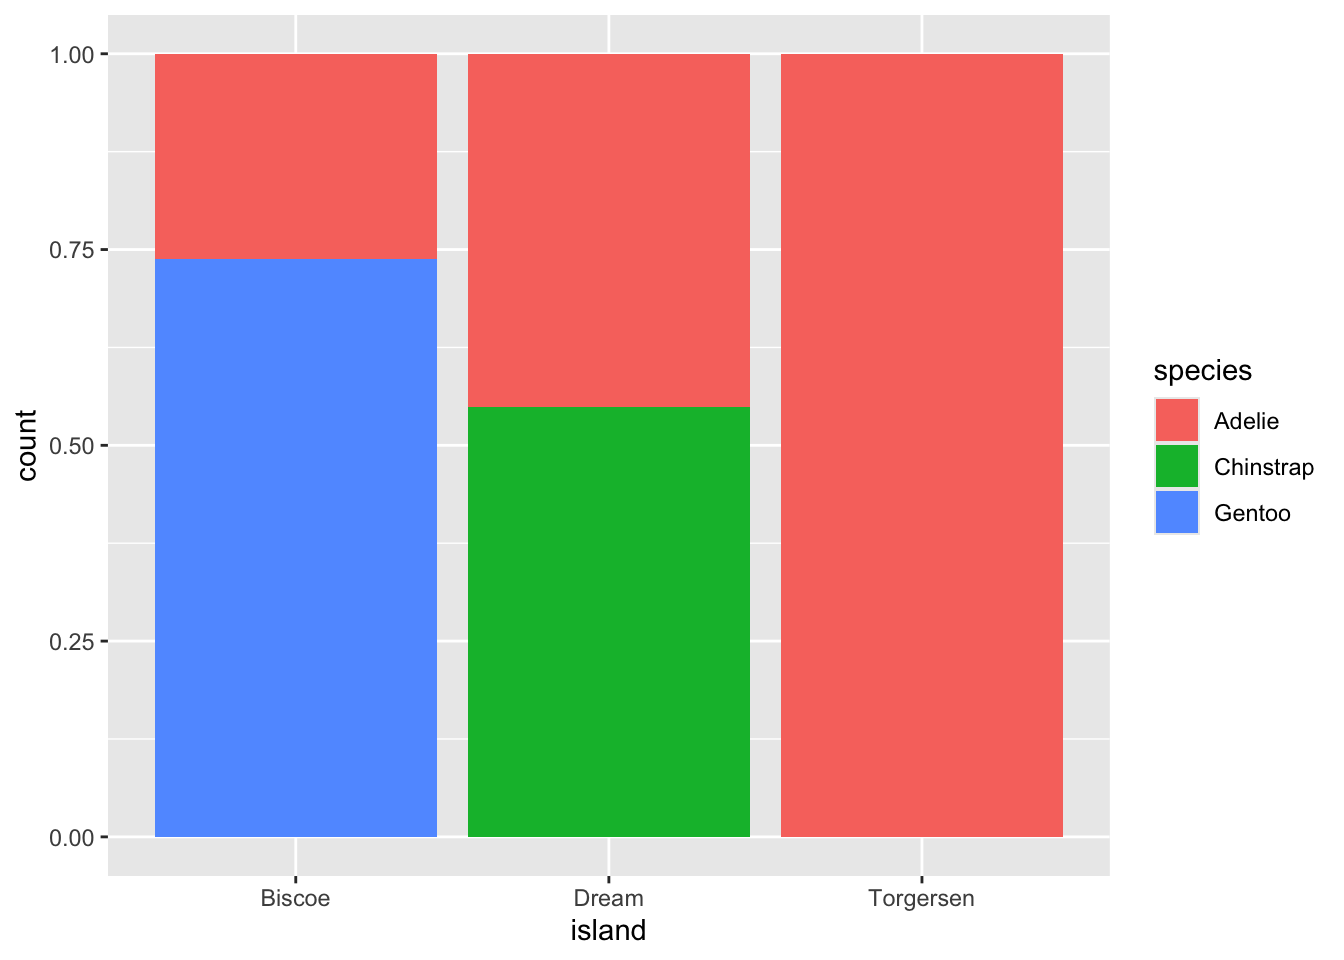
Torgersen only contains Adelie species
Dream is roughly 50/50 Adelie and Chinstrap
Biscoe is 75/25 Gentoo and Adelie
Only Adelie penguins were observed on all three islands
Biological measurements vs. species
Are these species substantively different in terms of size?
ggplot(data = penguins, mapping = aes(x = bill_len)) +
  geom_histogram() +
  facet_wrap(facets = vars(species))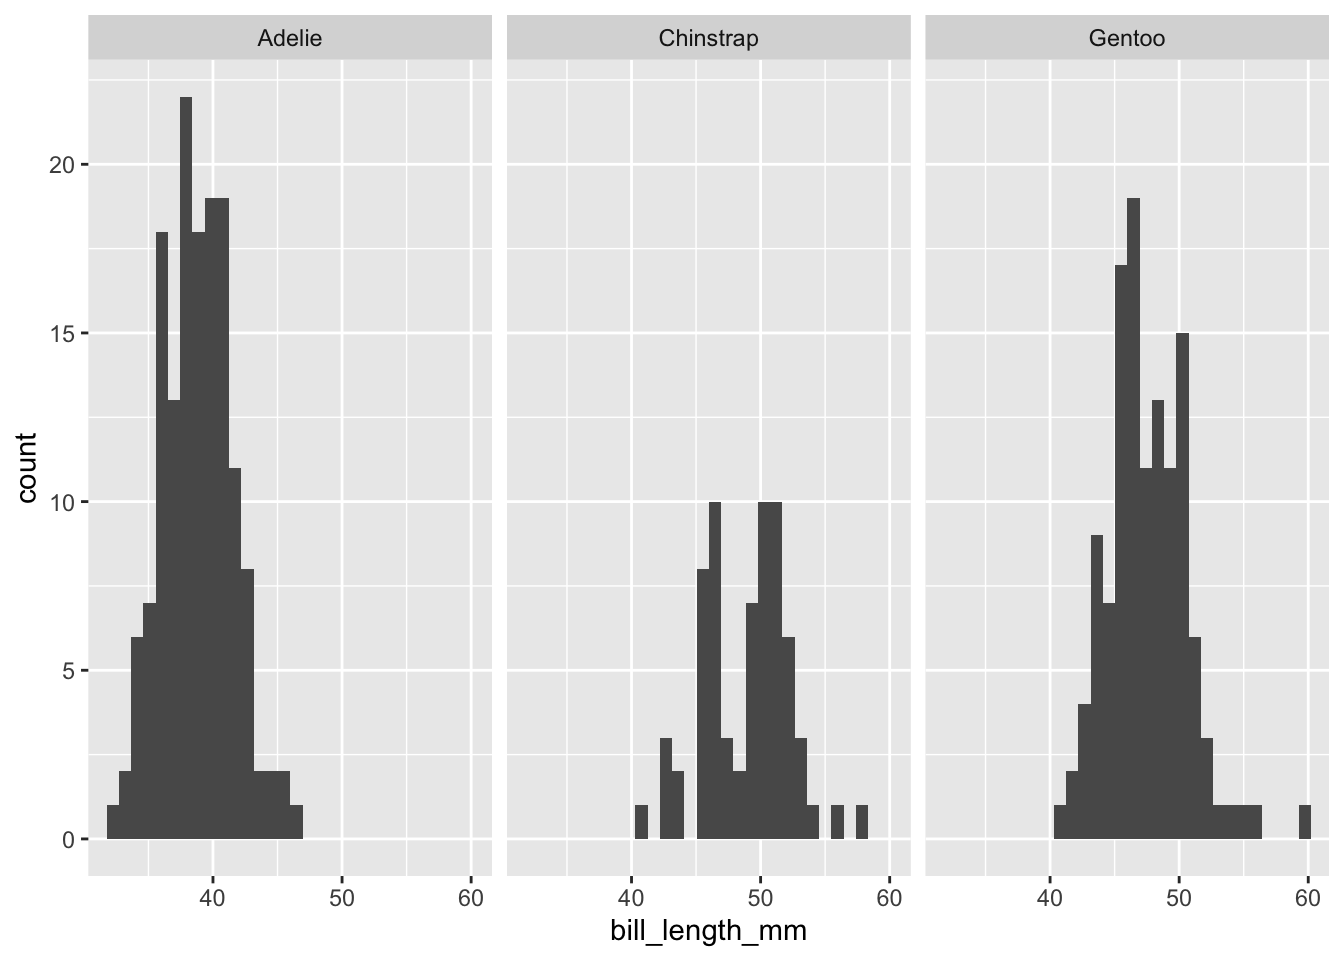
ggplot(data = penguins, mapping = aes(x = bill_len)) +
  geom_histogram() +
  facet_wrap(facets = vars(species), scales = "free_y")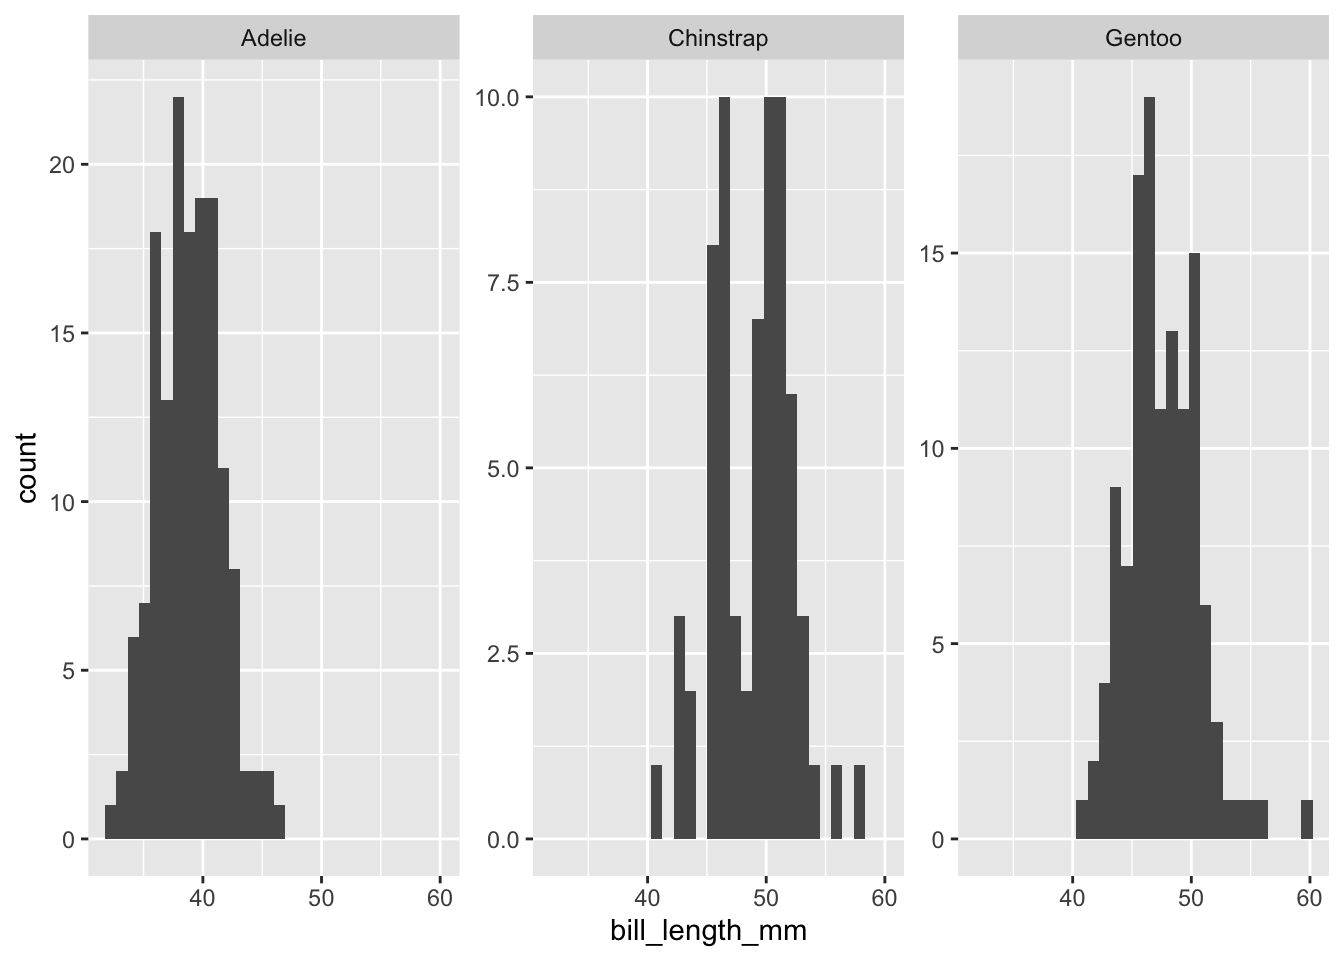
- Adelie penguins have shorter bills than Gentoo or Chinstrap
ggplot(data = penguins, mapping = aes(x = body_mass)) +
  geom_histogram() +
  facet_wrap(facets = vars(species))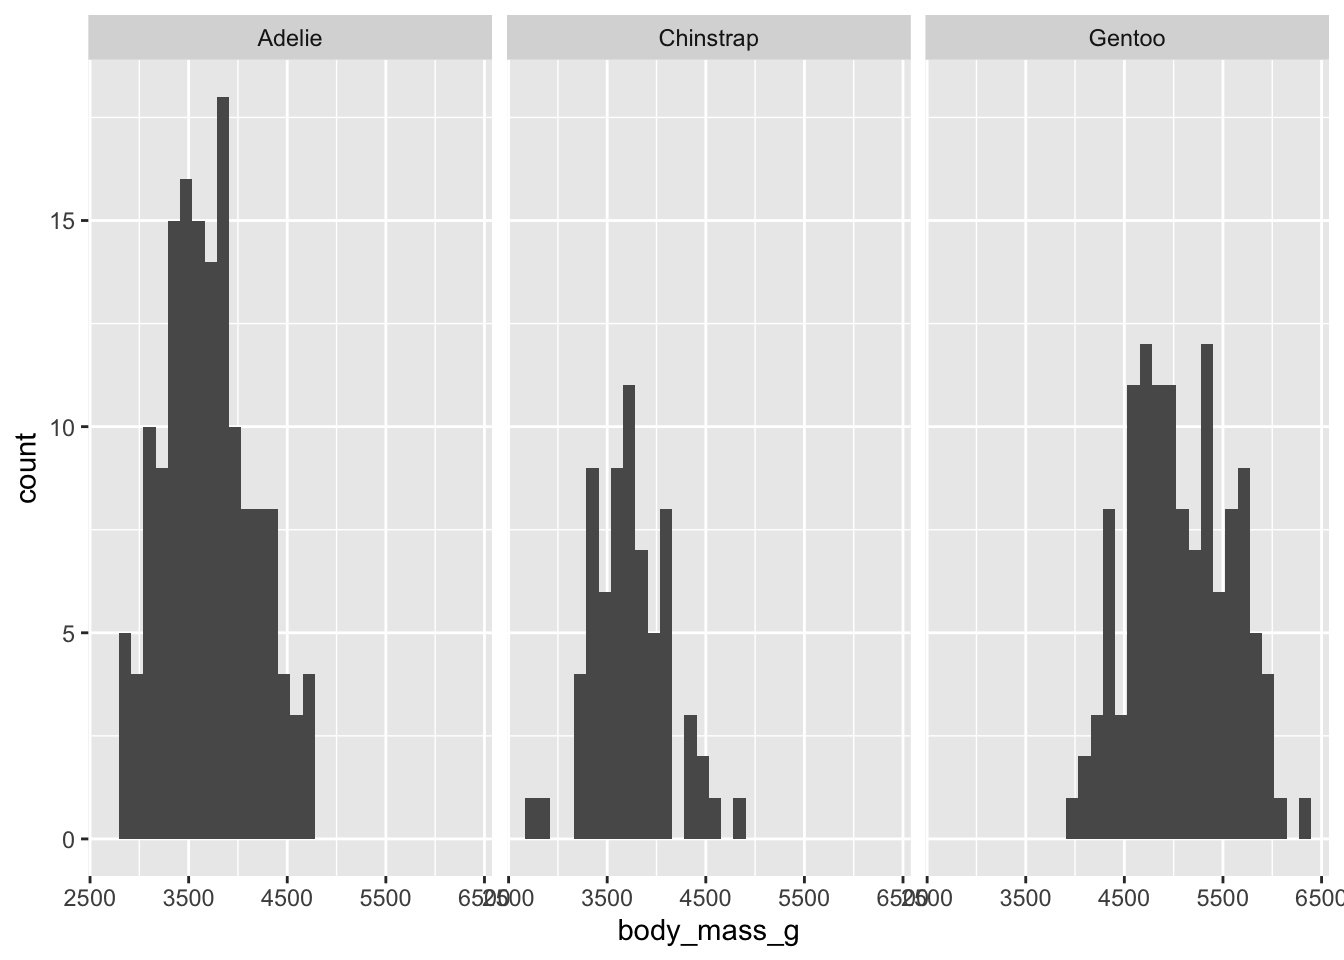
ggplot(data = penguins, mapping = aes(x = body_mass)) +
  geom_histogram() +
  facet_wrap(facets = vars(species), scales = "free_y")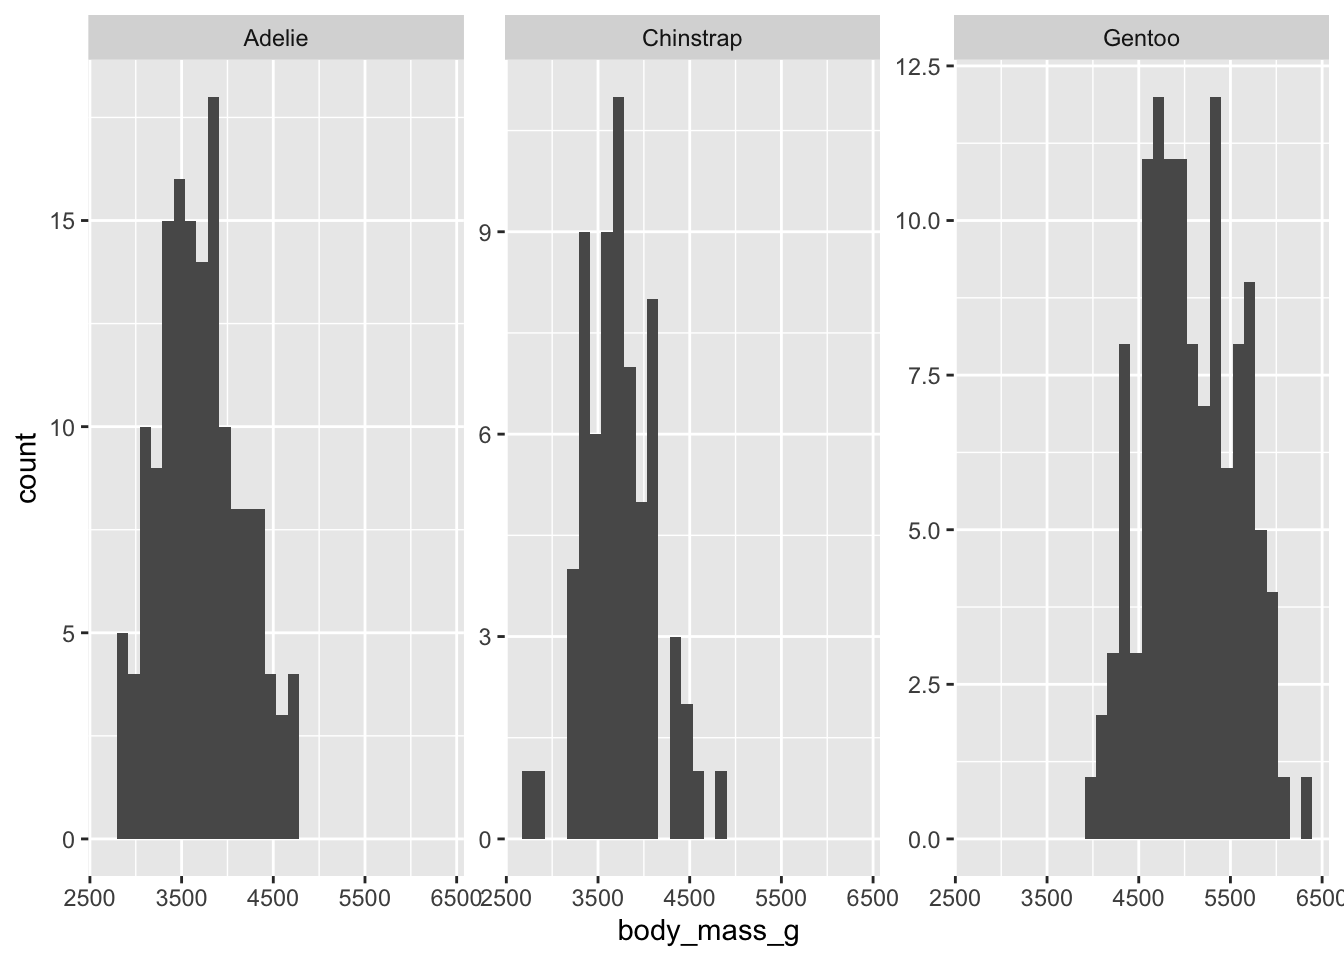
- Gentoo penguins are chonkier than the other two species (higher typical mass)
ggplot(data = penguins, mapping = aes(x = flipper_len)) +
  geom_histogram() +
  facet_wrap(facets = vars(species))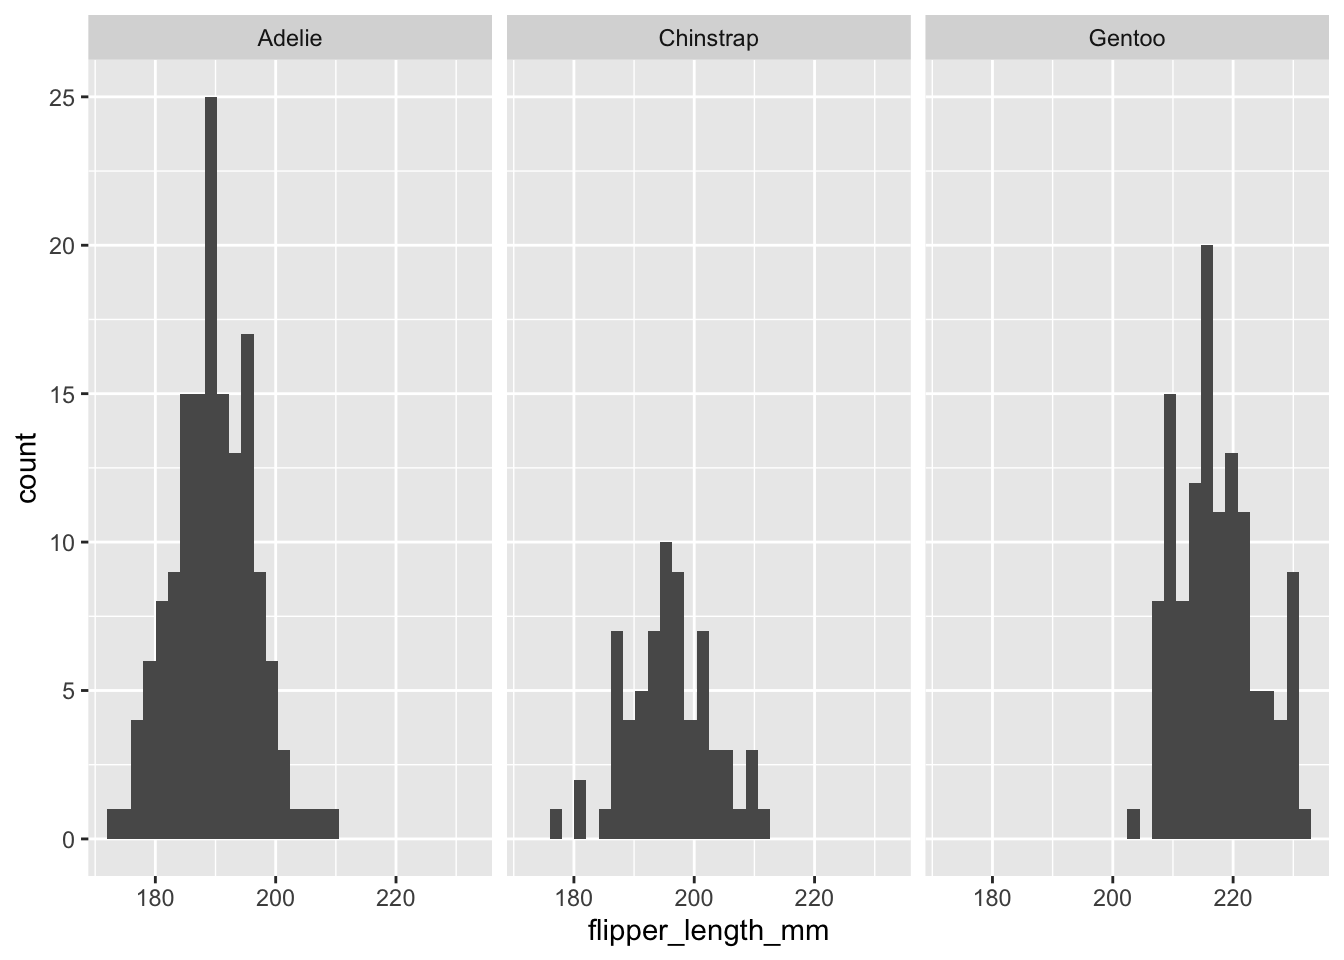
ggplot(data = penguins, mapping = aes(x = flipper_len)) +
  geom_histogram() +
  facet_wrap(facets = vars(species), scales = "free_y")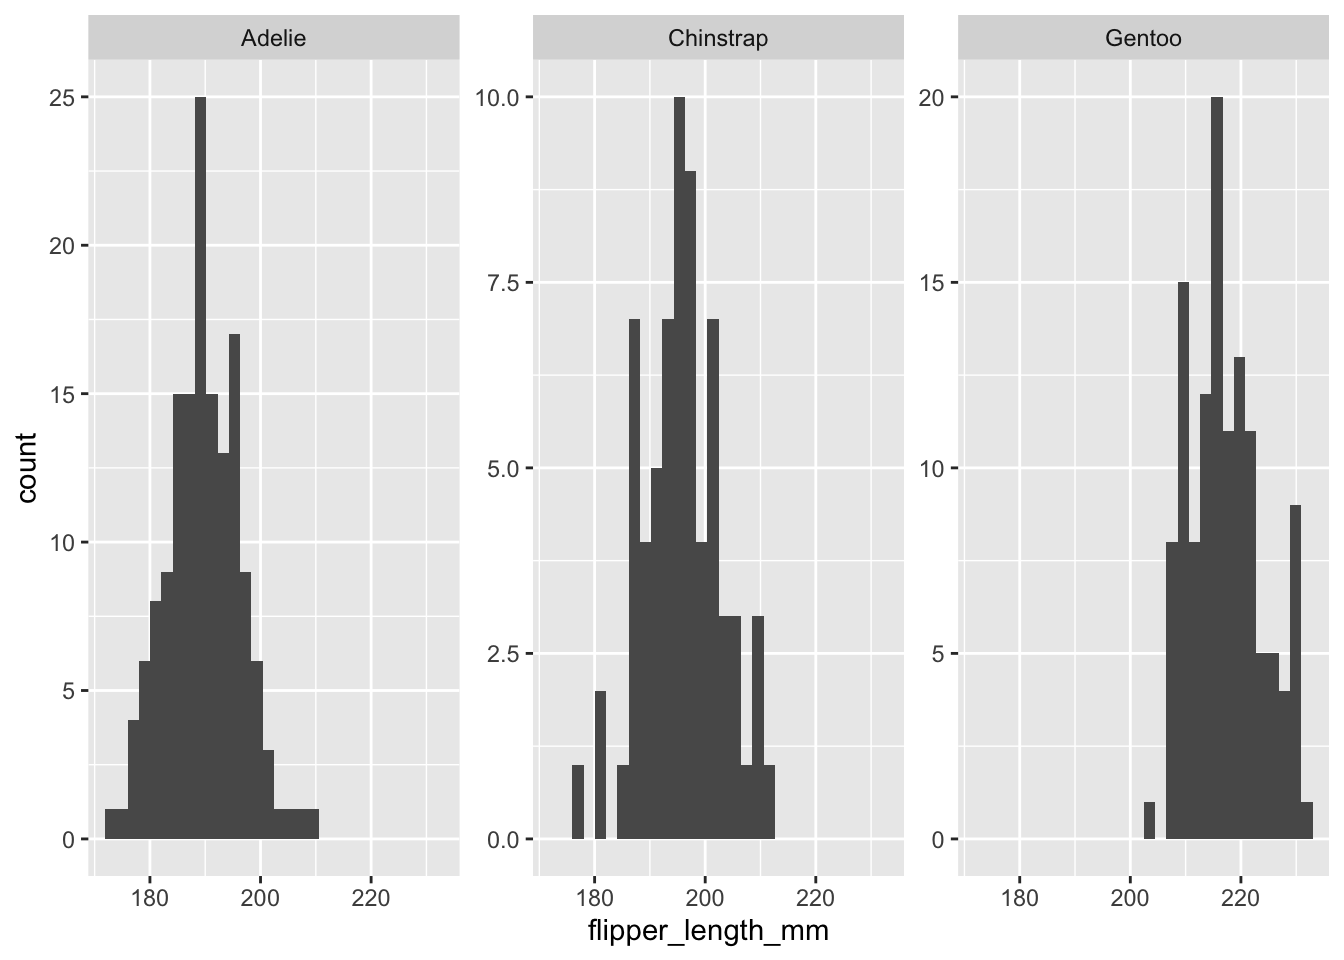
- Gentoo penguins tend to have longer flippers
- Seems like Gentoos are just bigger overall
Body mass vs. flipper size
ggplot(data = penguins, mapping = aes(x = flipper_len, y = body_mass)) +
  geom_point()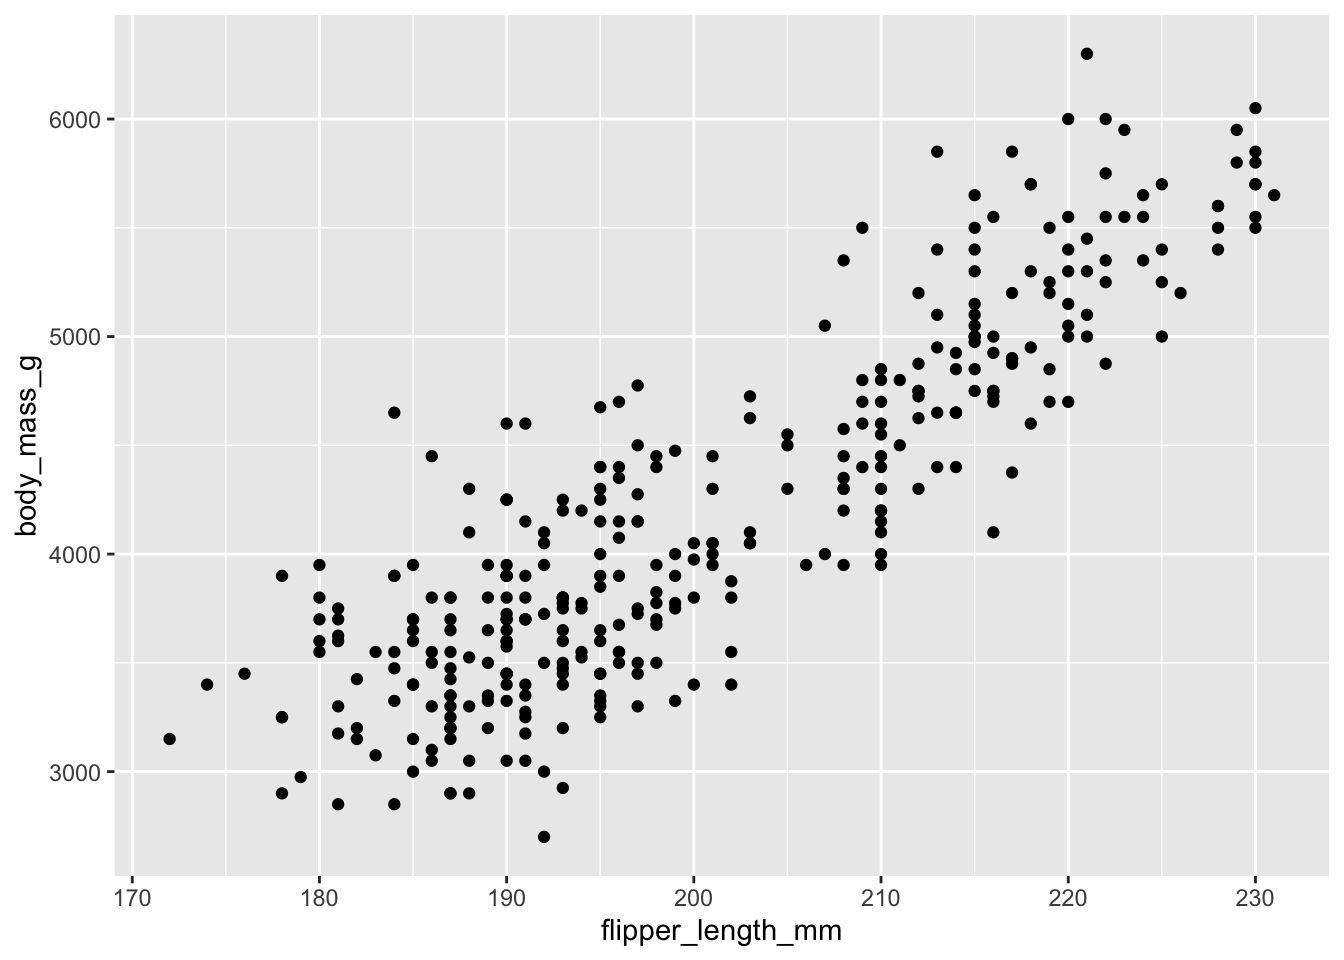
ggplot(data = penguins, mapping = aes(x = flipper_len, y = body_mass)) +
  geom_point(mapping = aes(color = species))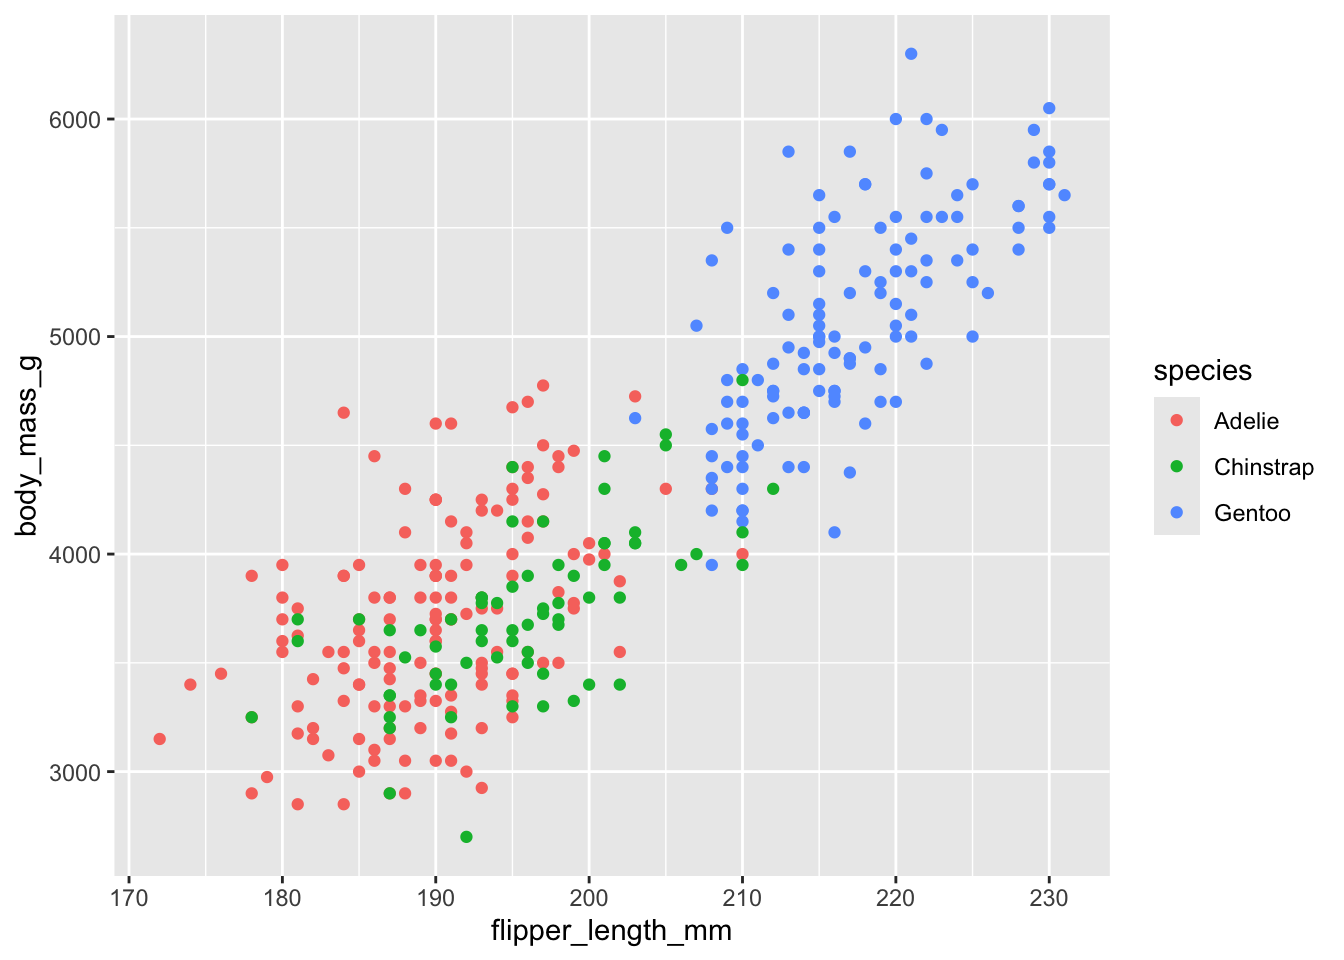
ggplot(data = penguins, mapping = aes(x = flipper_len, y = body_mass)) +
  geom_point(mapping = aes(color = species)) +
  facet_wrap(facets = vars(species))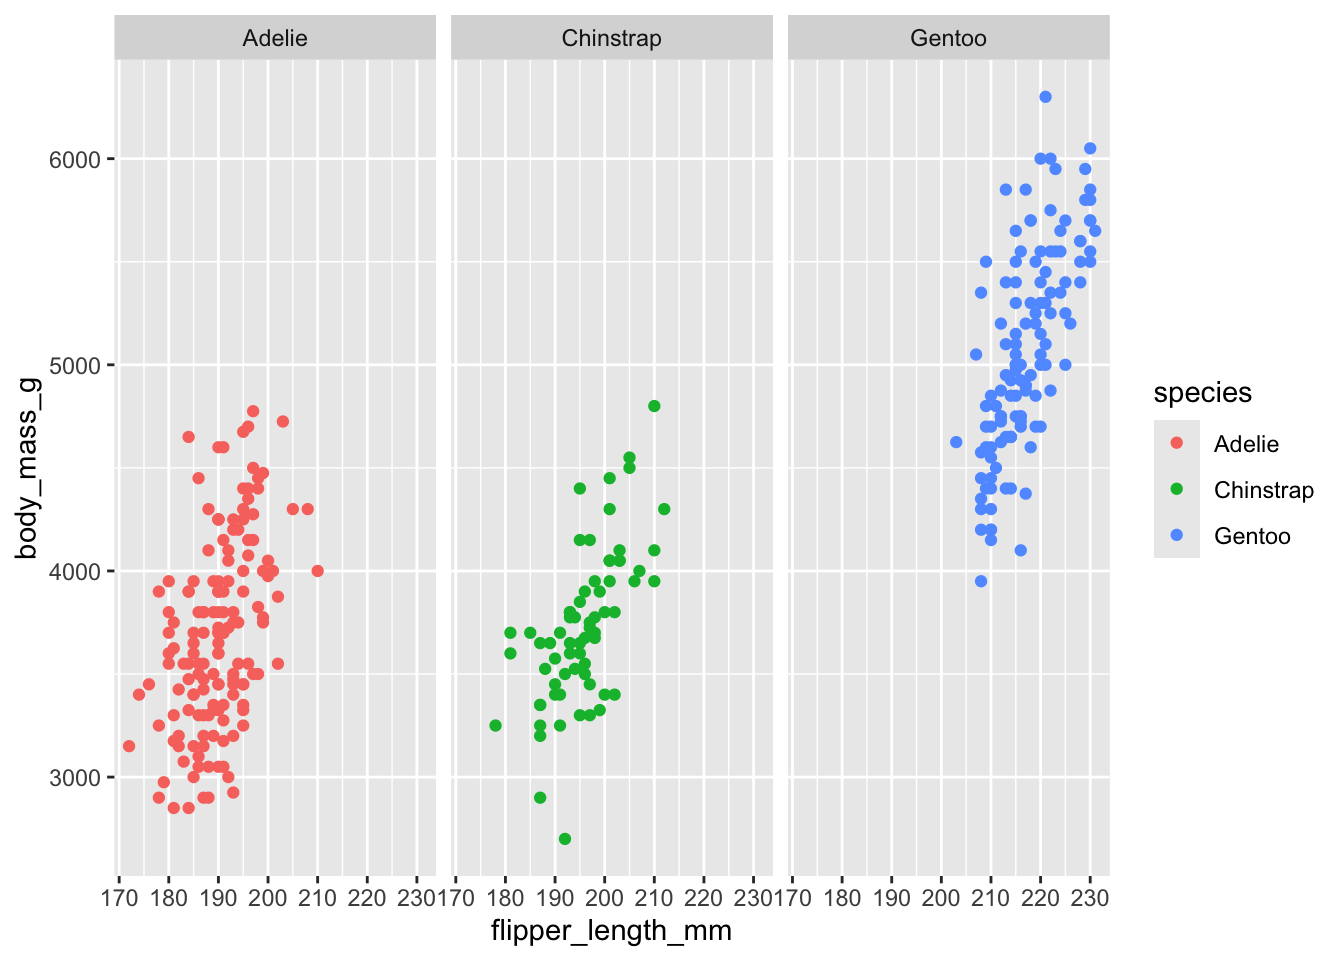
ggplot(data = penguins, mapping = aes(x = flipper_len, y = body_mass)) +
  geom_point(mapping = aes(color = species)) +
  geom_smooth(method = "lm") +
  facet_wrap(facets = vars(species))
- Positive relationship between flipper length and body mass
- Gentoo penguins are larger than the other two species
- Not sure if trends are different across species or just different in scale