![]()
Exam 02
Exam
Overview
Exam 2 (the final exam) will be held on Saturday, May 17 at 2pm in Olin Hall 255. It will be a 150 minute in-person, timed-exam.
The exam will largely focus on statistical/machine learning techniques from lecture 16 (Hypothesis testing with randomization ) through the final day of class. While some topics or methods may appear from the first-half of the course, the exam heavily focuses on the second-half of the course.
It will consist of a series of multiple choice, short answer, and free response questions. Questions are designed to evaluate your knowledge of core statistical concepts, apply appropriate techniques given a research question, and interpret the results of statistical analysis (e.g. descriptive statistics, linear regression, logistic regression, ML models, confidence intervals, hypothesis testing, performance metrics). You may be asked to answer conceptual questions, interpret visualizations, interpret code and output, and write code by hand.1
1 Though I don’t expect nearly as much code-writing as in exam 01, you should still be prepared to write straight-forward operations by hand.
Students with SDS accommodations
Students who have registered SDS accommodations related to timed assignments are implemented by the SDS Alternative Testing Program. You will receive separate instructions from SDS about how to take the exam with your accommodations. If you have any questions about your accommodations, please contact SDS directly.
Students with religious or other accommodations
If you require an accommodation for exam 02 on the basis of religious observances, athletics, military service, or another accommodation listed on the course syllabus, please complete this Google form and email any supporting documentation to info2951@cornell.edu by May 1st. Any accommodation requests received after this date are unlikely to be approved.
Rules & Notes
Academic Integrity
- A student shall in no way misrepresent his or her work.
- A student shall in no way fraudulently or unfairly advance his or her academic position.
- A student shall refuse to be a party to another student’s failure to maintain academic integrity.
- A student shall not in any other manner violate the principle of academic integrity.
- This is an individual assignment. Everything in the exam is for your eyes only.
- The exam will be held in-person. All responses will be written by hand and submitted on paper.
- You may not use any electronic devices during the exam.2 This includes laptops, tablets, phones, smartwatches, etc.
- You may not use any physical materials during the exam. This includes textbooks, notes, calculators, etc. Any required formulas will be provided in the exam.
2 Students with SDS accommodations are permitted to use a computer.
Submission
- All responses will be submitted on paper using the provided forms. Exams will not be returned to students, though you may request to review your exam in-person at a later date.
Grading
- Exam 02 is worth 20% of your final grade.
Practice problems
Instructions
Below are some practice problems you may complete in order to prepare for the exam. The suggested solution is hidden below each exercise. Try to solve the problem on your own before looking at the solution.
-
Suppose you are evaluating a medical test for detecting a rare disease. The test results can be positive (indicating the presence of the disease) or negative (indicating the absence of the disease). Consider the following scenarios:
- False Positive (Type I Error):
- The test result is positive, but the person does not actually have the disease.
- Probability of a false positive: 0.05 (5%).
- Denoted as: FP.
- False Negative (Type II Error):
- The test result is negative, but the person actually has the disease.
- Probability of a false negative: 0.10 (10%).
- Denoted as: FN.
Which of the following statements is correct?
- A false positive occurs when the test result is negative, but the person has the disease.
- A false negative occurs when the test result is positive, and the person has the disease.
- A false positive occurs when the test result is positive, but the person does not have the disease.
- A false negative occurs when the test result is negative, and the person does not have the disease.
Suggested solution- A false positive occurs when the test result is positive, but the person does not have the disease.
- False Positive (Type I Error):
-
Suppose you are analyzing a dataset with a small sample size, and you want to estimate the mean of a certain variable. You decide to use a simulation-based approach to generate confidence intervals. Which method should you choose?
- Permutation method
- Bootstrap method
- Both methods are equally valid
- Neither method is appropriate for this scenario
Suggested solution- Bootstrap method
-
Public policy researchers are studying whether a new school lunch program reduces the incidence of obesity amongst elementary school children. The authors compute the p-value for their sample to be 0.10. Which of the following interpretations of the p-value is correct?
- The probability that the policy is effective.
- The probability that the policy is not effective.
- The probability of determining the policy is not effective when it actually is.
- The probability of getting results as extreme or more extreme than the ones in the study if the policy is actually effective.
- The probability of getting results as extreme or more extreme than the ones in the study if the policy is actually not effective.
Suggested solution- The probability of getting results as extreme or more extreme than the ones in the study if the policy is actually not effective.
-
Which of the following feature engineering steps is not required for fitting a nearest neighbors model?
- Normalizing all quantitative variables to the same mean and variance.
- Converting nominal predictors to quantitative variables.
- Remove all features with zero variance.
- Downsample the training set so there are an equal number of observations for each class.
Suggested solution- Downsample the training set so there are an equal number of observations for each class.
-
Given the following graph, which transformations could make the data linear?
- \(y \rightarrow \sqrt y\)
- \(x \rightarrow \sqrt x\)
- \(y \rightarrow \ln y\)
- \(x \rightarrow \ln x\)
- Either A or C
- Either B or D
- None of the above
Suggested solution- Either A or C
-
Interpreting linear regression models with log-transformed variables. Fill in the shorter blanks with one of the following phrases:
- 1% change
- one unit change
Fill in the longer blanks with one of the following values:
- \(b_1\) units
- \(0.01 \times b_1\) units
- \(100 \times [\exp(b_1) - 1]\%\)
- \(b_1\)%
For a log-linear model \(\widehat{\ln(Y)} = b_0 + b_1 X\):
For every _____ in \(X\), we expect \(Y\) to be higher/lower by ________________, on average.
For a linear-log model \(\widehat{Y} = b_0 + b_1 \ln (X)\):
For every _____ in \(X\), we expect \(Y\) to be higher/lower by ________________, on average.
Suggested solutionFor a log-linear model \(\widehat{\ln(Y)} = b_0 + b_1 X\): For every one unit change in \(X\), we expect \(Y\) to be higher/lower by \(100 \times [\exp(b_1) - 1]\%\).
For a linear-log model \(\widehat{Y} = b_0 + b_1 \ln (X)\): For every 1% change in \(X\), we expect \(Y\) to be higher/lower by \(0.01 \times b_1\) units, on average.
-
A research study investigates whether a new prenatal vitamin supplement affects the duration of pregnancy (gestational length). Researchers randomly assign pregnant women to two groups: one group receives the new supplement, and the other group receives a placebo. The outcome variable is the gestational length in weeks.
Topic/Research Question: “Does the new prenatal vitamin supplement lead to a different average gestational length compared to the placebo?”
State the null hypothesis (\(H_0\)) and the alternative hypothesis (\(H_A\)) for this study.
Suggested solution- Null Hypothesis (\(H_0\)): The average gestational length for women who receive the new prenatal vitamin supplement is equal to the average gestational length for women who receive the placebo.
- Alternative Hypothesis (\(H_A\)): The average gestational length for women who receive the new prenatal vitamin supplement is different from the average gestational length for women who receive the placebo (two-sided test).
-
Describe in a few sentences how ordinary least squares (OLS) regression works. How does it determine the values for the estimated coefficients?
Suggested solutionOLS regression is a method used to estimate the relationship between one or more independent variables and a dependent variable. The goal of OLS is to minimize the sum of squared differences between the observed and predicted values of the dependent variable.
-
Suppose you construct a 95% confidence interval for the difference in average scores between two groups and obtain the interval (2.1, 7.4). A colleague asks whether this result would be considered statistically significant at the \(\alpha = 0.05\) level.
How would you respond? Explain the connection between confidence intervals and hypothesis testing in this context.
Suggested solutionYes, the result is statistically significant at the \(\alpha = 0.05\) level. A 95% confidence interval corresponds to a two-sided hypothesis test with \(\alpha = 0.05\). Since the null hypothesis typically assumes no difference (i.e., difference = 0), and 0 is not contained in the interval (2.1, 7.4), we would reject the null hypothesis at the 5% level. The confidence interval provides a range of plausible values for the true difference, and since 0 is not one of them, the difference is considered statistically significant.
-
What is a node in a decision tree?
Suggested solutionA node in a decision tree represents a decision point or a condition based on the features of the data.
There are two main types of nodes:
Decision (Internal) Node: This node splits the data based on a condition or rule (e.g., “Is age > 30?”). The data is divided into subsets based on the feature’s value at this node, and this process continues recursively in the tree.
Leaf (Terminal) Node: This node provides the final outcome or prediction. It represents the class label (in classification) or a predicted value (in regression) for the data points that fall into that node.
In a decision tree, internal nodes represent decisions or tests, while leaf nodes provide the final prediction or classification.
-
Suppose you are working on a credit risk model for a bank. The goal is to predict whether a loan applicant will default (1) or not (0) based on features such as credit score, income, and debt-to-income ratio. After training your logistic regression model, you find that the training ROC AUC is significantly higher than the test ROC AUC. Explain why this discrepancy might occur.
Suggested solutionThe observed discrepancy between training and test ROC AUC can be attributed to overfitting.
-
The Great Britain Office of Population Census and Surveys collected data on a random sample of 170 married couples in Britain, recording the age (in years) and heights (converted here to inches) of the partners. The scatterplot on the left shows the heights of the partners plotted against each other and the plot on the right shows the ages of the partners plotted against each other.
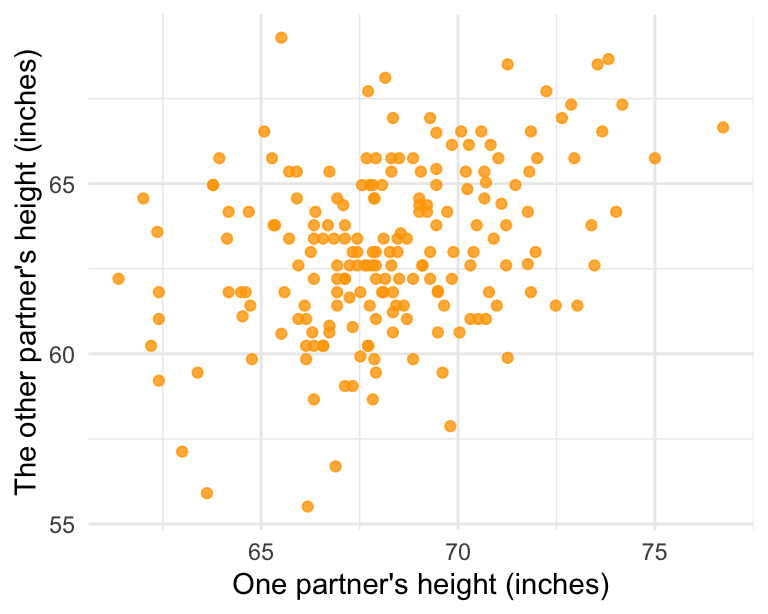
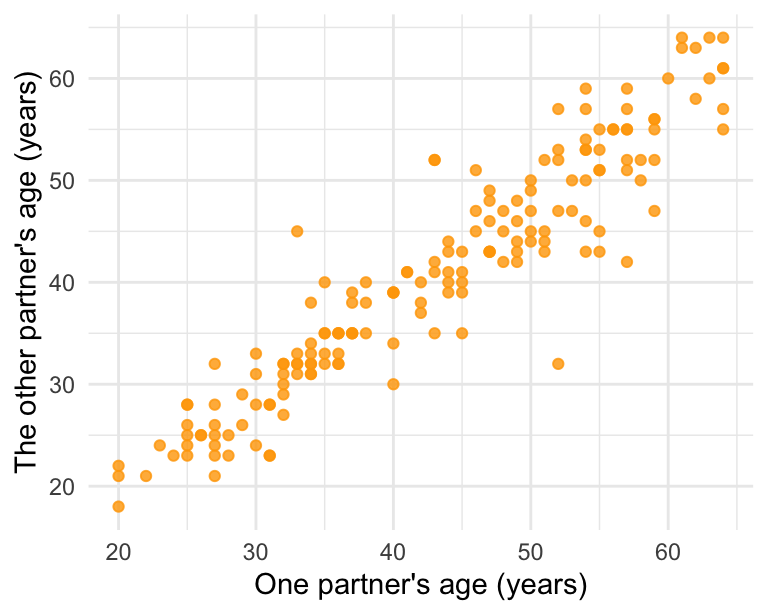
- Describe the relationship between partners’ heights.
- Describe the relationship between partners’ ages.
- Which plot shows a stronger correlation? Explain your reasoning.
Suggested solution- The association between husbands’ and wives’ heights is weak but positive.
- The association between husbands’ and wives’ ages is positive, weak, and linear.
- The age plot, where there is a more evident linear trend in the data.
-
What is the purpose of
set_engine()?Suggested solutionThe
set_engine()function is used to specify the computational engine or algorithm that will be used to fit a model in the {tidymodels} framework. It allows you to choose from different implementations of a model, since multiple engines may be available for the same model. -
Below is data from the Cornell Dairy Bar reporting their monthly sales revenue from the past 12 months along with the average monthly temperature (in degrees Celsius).
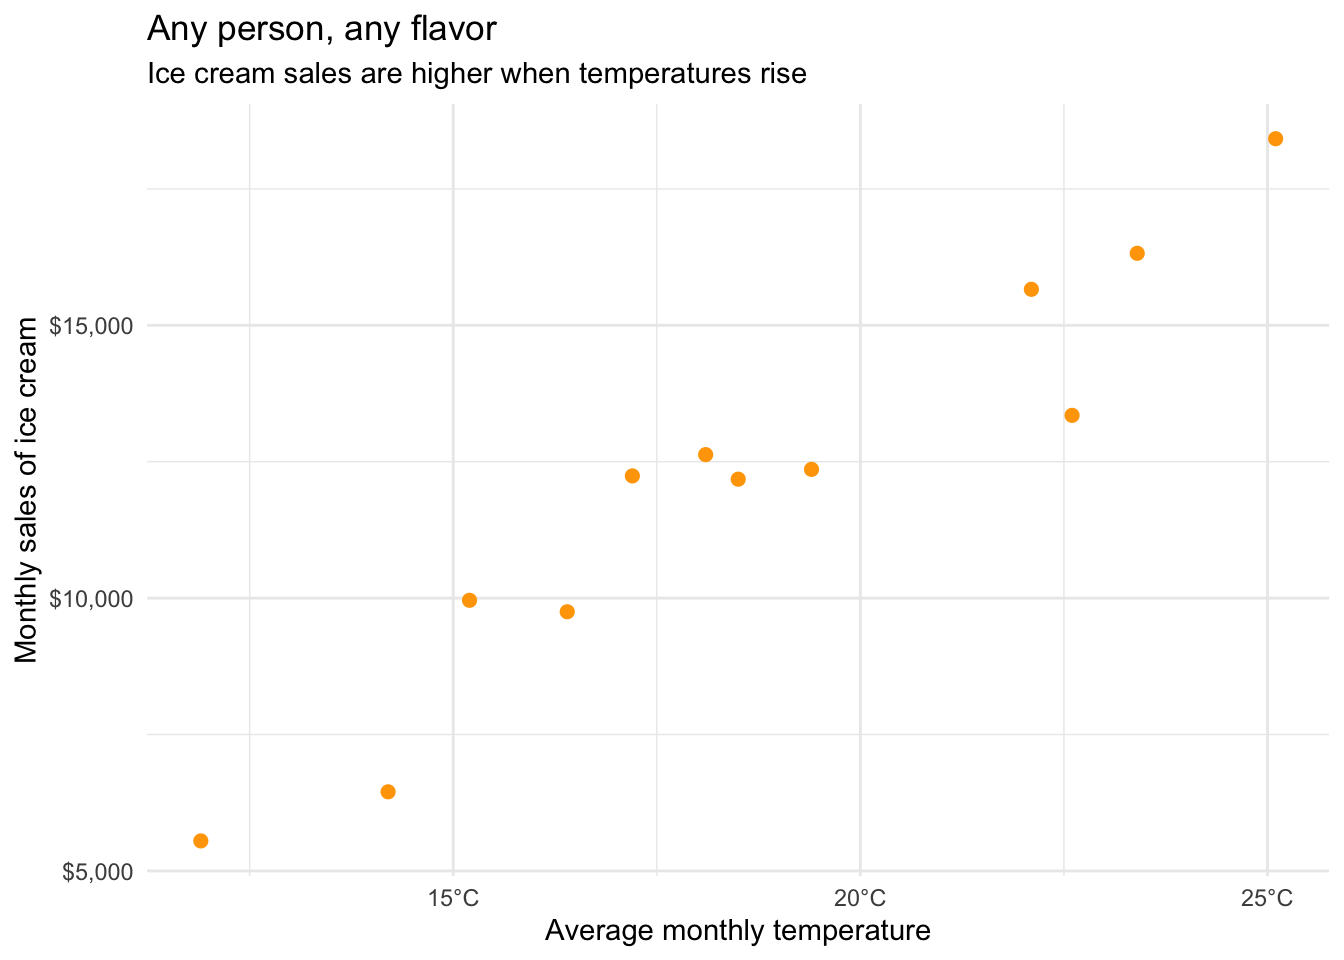
The correlation between average monthly temperature and ice cream sales is \(0.96\). Below is a temperature conversion chart.
From To Fahrenheit To Celsius To Kelvin Fahrenheit (\(^{\circ} F\)) \(^{\circ} F\) \(\frac{5}{9} \times (^{\circ} F - 32)\) \(^{\circ} F - 32 \times \frac{5}{9} + 273.15\) Celsius (\(^{\circ} C\)) \((^{\circ} C \times \frac{9}{5}) + 32\) \(^{\circ} C\) \(^{\circ} C + 273.15\) Kelvin \((K)\) \((K - 273.15) \times \frac{9}{5} + 32\) \(K - 273.15\) \(K\) - What would the correlation be if we converted temperature to Kelvin? Report the value as a number between -1 and +1.
- What would the correlation be if we converted temperature to degrees Fahrenheit? Report the value as a number between -1 and +1.
Suggested solution- \(0.96\)
- \(0.96\)
-
When we conduct a null hypothesis test and the \(p\)-value is greater than our significance level threshold, why do we state that we “fail to reject the null hypothesis” as opposed to “accept the null hypothesis”?
Suggested solutionWe state that we “fail to reject the null hypothesis” rather than “accept the null hypothesis” because the absence of evidence is not evidence of absence. A non-significant result does not provide conclusive evidence in favor of the null hypothesis; it simply means that we do not have enough evidence to reject the null hypothesis.