AE 08: Using {duckdb} for NYC flights
Packages
We will use the following packages in this application exercise.
- {tidyverse}: For data import, wrangling, and visualization.
- {duckdb}: To query a DuckDB.
- {dbplyr}: To translate our {dplyr} and {tidyr} functions to SQL.
- {scales}: Formatting graph labels.
New York City flights data
The U.S. Department of Transportation publishes detailed statistics on flights originating in the United States. {nycflights13} is a highly popular R package containing information on all flights that departed NYC1 in 2013. The package was originally developed to provide practice wrangling and working with relational datasets.
1 Specifically, John F. Kennedy International Airport (JFK), LaGuardia Airport (LGA), and Newark International Airport (EWR).
That said, this package has become quite dated since it was originally developed in the mid-2010s. The same air travel data can be accessed for any airports in the United States using the {anyflights} package. The challenge is that data for more than a trivial handful of airports and years becomes significantly large and unwieldy to utilize.
To solve these issues, we will utilize a DuckDB that contains detailed air travel data for all NYC airports from 2015-2023. This dataset can be access from data/nyc-flights.duckdb.
Connect to the database
Demonstration: Connect to the local database and identify the tables.
con <- duckdb(dbdir = "data/nyc-flights.duckdb") |>
dbConnect()
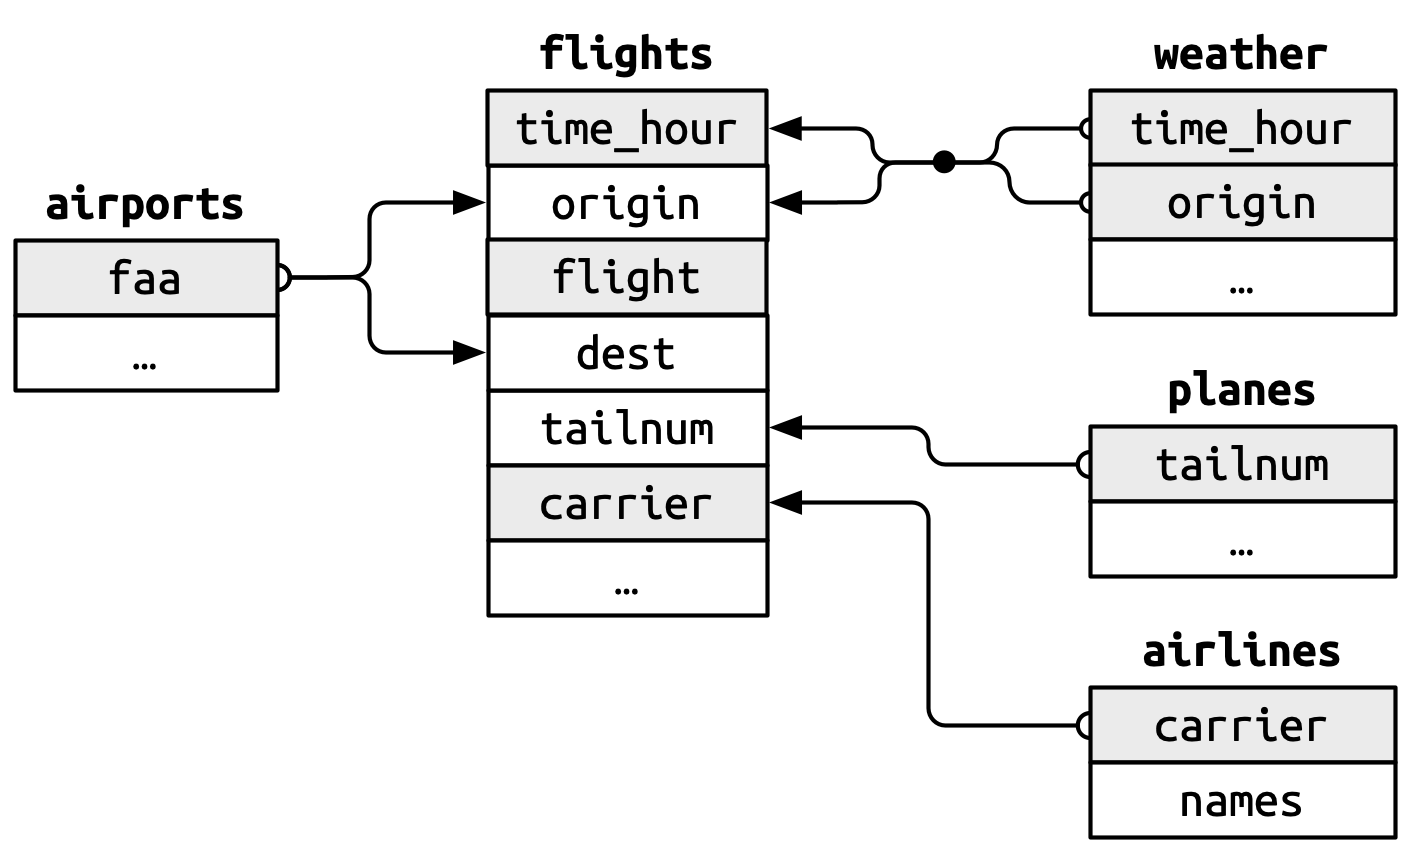
dbListTables(con)[1] "airlines" "airports" "flights" "planes" "weather" The database has the following relational structure:
Demonstration: Use tbl() to create an object that represents each database table. This will allow us to use {dbplyr} to translate our code to the corresponding SQL query.
Translate some basic SQL queries
Your turn: Explain what each of the following SQL queries does, and recreate them using {dbplyr}.
SELECT flights.*
FROM flights
WHERE (dep_delay < arr_delay)
Add response here.
# add code hereSELECT flights.*, distance / (air_time / 60.0) AS speed
FROM flightsAdd response here.
# add code hereWhat causes flight delays?
Your turn: What is the relationship between weather events and departure delays? Calculate the average departure delay and join with the weather table. How do these R commands translate to SQL? What trends do you see?
- Before summarizing
flights, examine theweathertable and figure out its unit of analysis. This will clue you in to how best to summarize theflightsdata. - Use
show_query()to examine the translated SQL code.
# add code hereNumber of flights departing NYC airports over time
Now let’s examine potential patterns or trends in the volume of flights departing NYC-area airports over time.
Create a date variable
Your turn: Currently flights does not have a standalone date variable that identifies the date of the flight. Create one and store it at the beginning of the table.
lubridate::make_date() can create a date variable from numeric columns which contain each of the date components.
# add code hereVisualize the volume of flights over time
Demonstration: Calculate the daily number of departing flights from NYC and visualize as a line graph.
# add code hereDemonstration: Calculate a rolling seven-day average number of flights departing from NYC.
# add code here