Iteration
Lecture 13
Dr. Benjamin Soltoff
Cornell University
INFO 2951 - Spring 2025
March 6, 2025
Announcements
Announcements
- Lab 04
- Homework 05
- Project proposals due Wednesday
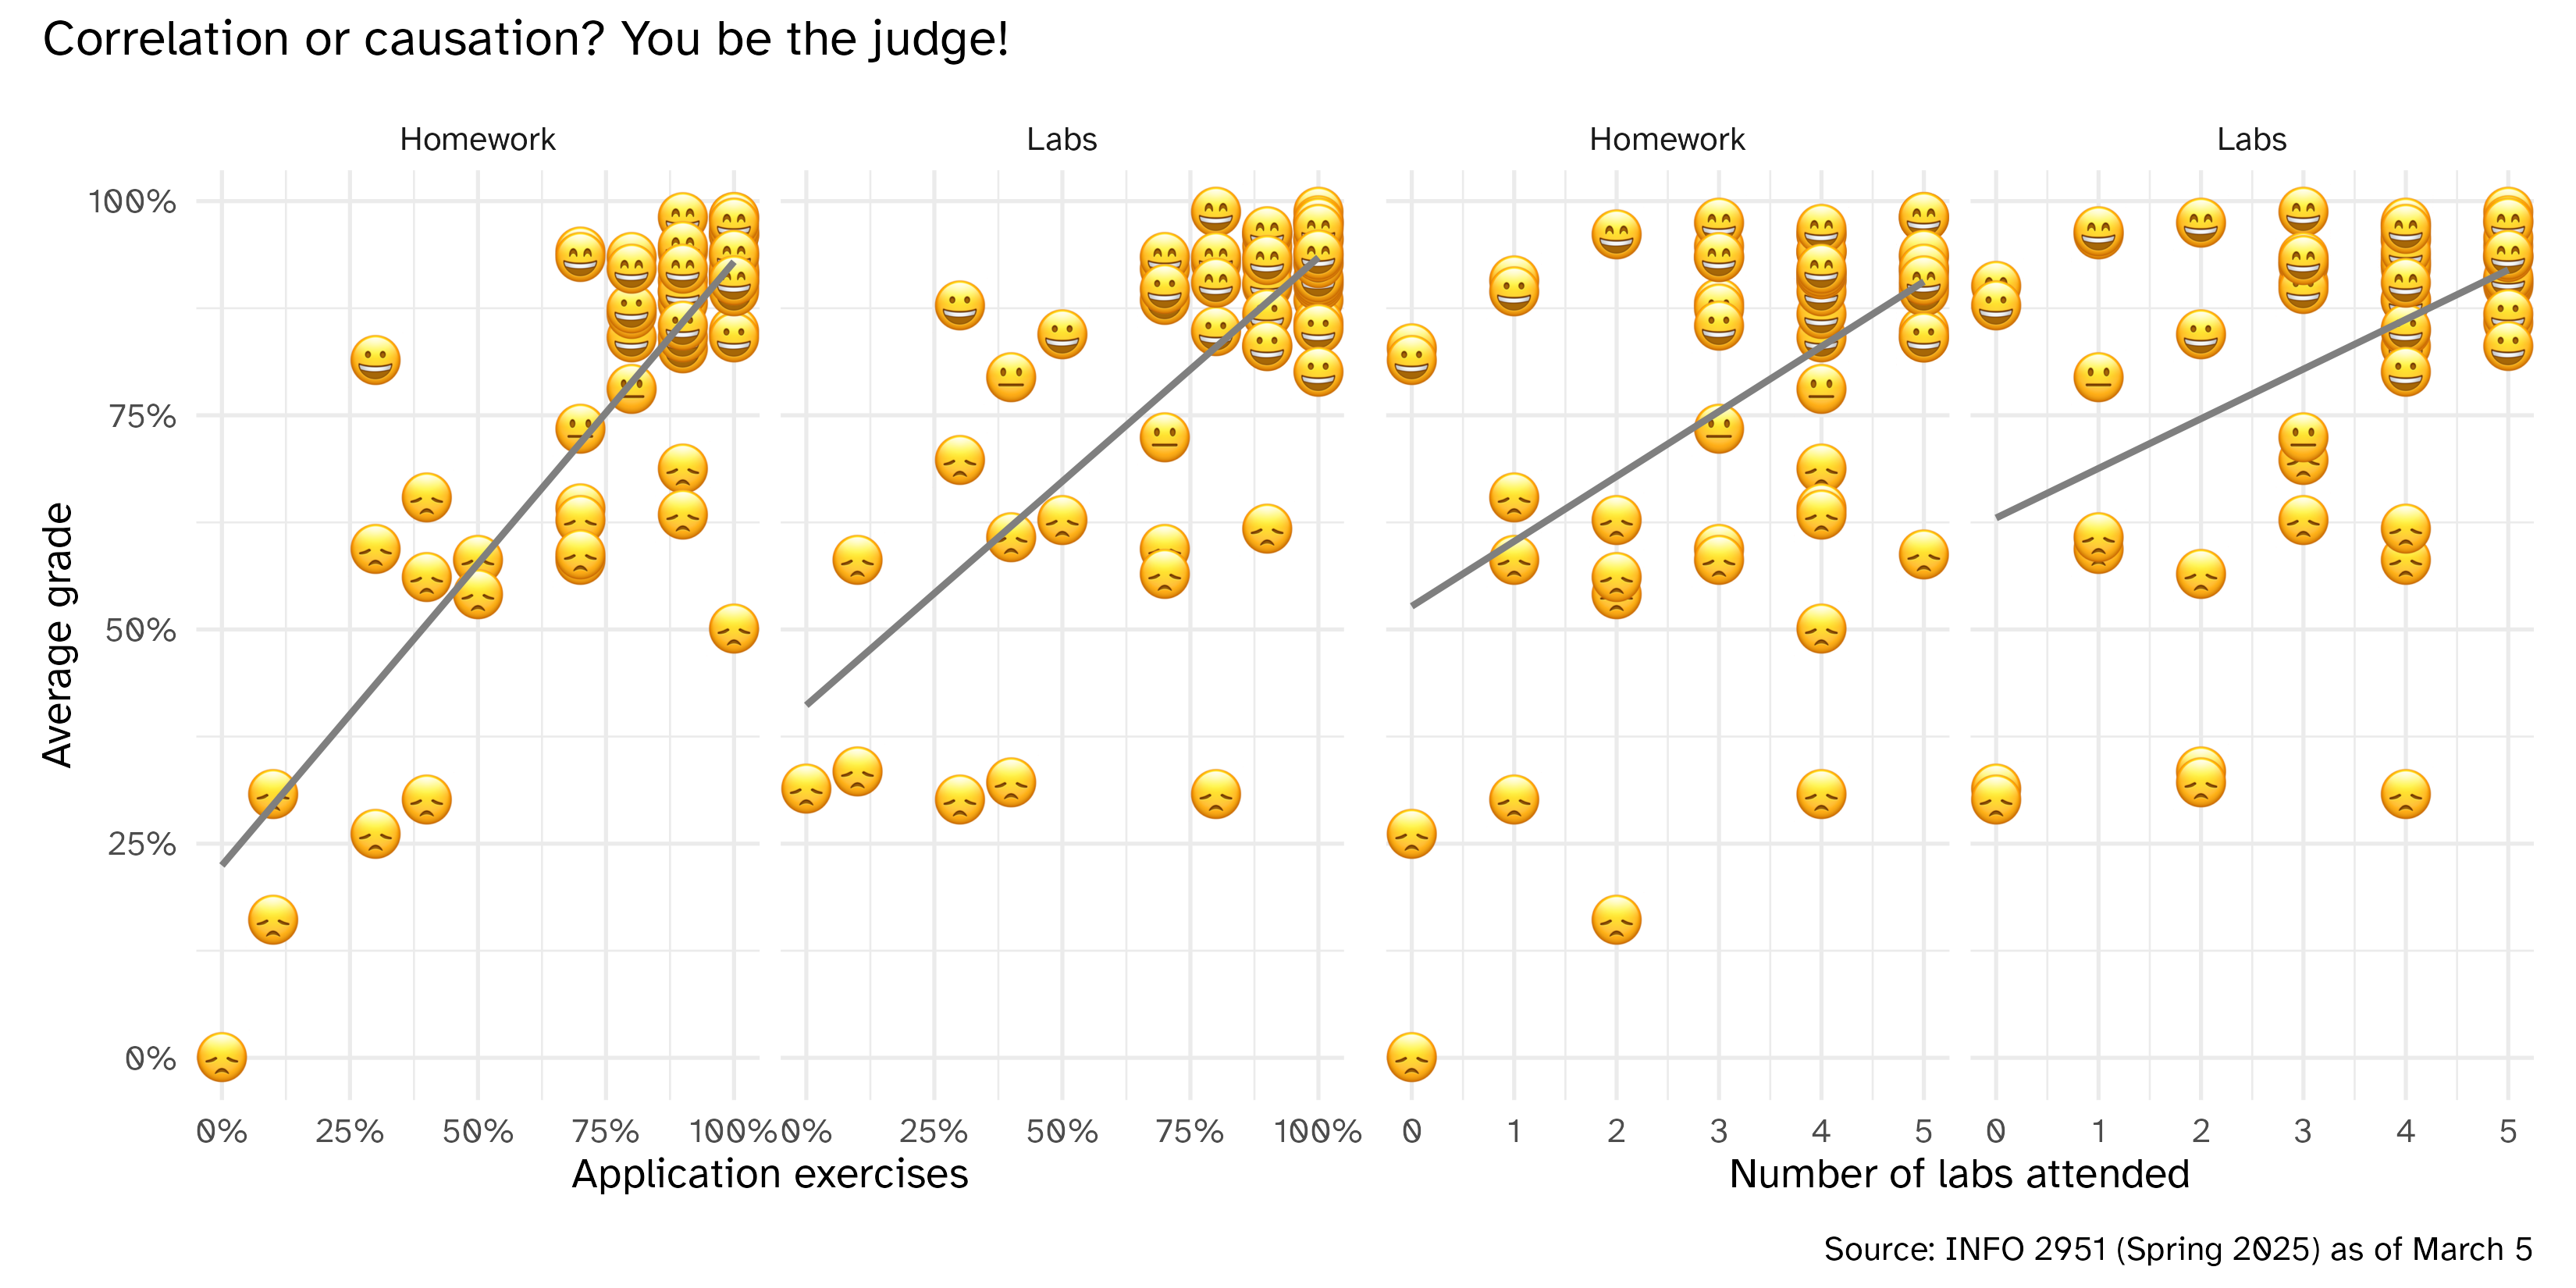
Students who participate in class perform better
Iteration
What is iteration?
- Iteration means repeating steps multiple times until a condition is met
- In other languages, iteration is performed with loops:
for,while
- Iteration is different in R
- You can use loops……. but you often don’t need to
Iteration in R
Iteration is an inherent part of the language. For example,
is
[1] 6 2 12 8and not
[1] 3 1 6 4 3 1 6 4Iteration in R
We have:
group_by()withsummarize()facet_wrap()across()purrr::map()
In other languages, a for loop would be right after “Hello world”
Iterating across() columns
penguins
Rows: 344
Columns: 8
$ species           <fct> Adelie, Adelie, Adelie, Adelie, Adelie, Adelie, Adel…
$ island            <fct> Torgersen, Torgersen, Torgersen, Torgersen, Torgerse…
$ bill_length_mm    <dbl> 39.1, 39.5, 40.3, NA, 36.7, 39.3, 38.9, 39.2, 34.1, …
$ bill_depth_mm     <dbl> 18.7, 17.4, 18.0, NA, 19.3, 20.6, 17.8, 19.6, 18.1, …
$ flipper_length_mm <int> 181, 186, 195, NA, 193, 190, 181, 195, 193, 190, 186…
$ body_mass_g       <int> 3750, 3800, 3250, NA, 3450, 3650, 3625, 4675, 3475, …
$ sex               <fct> male, female, female, NA, female, male, female, male…
$ year              <int> 2007, 2007, 2007, 2007, 2007, 2007, 2007, 2007, 2007…
Scenario
Recall our standard error function from last class:
Summarizing columns individually
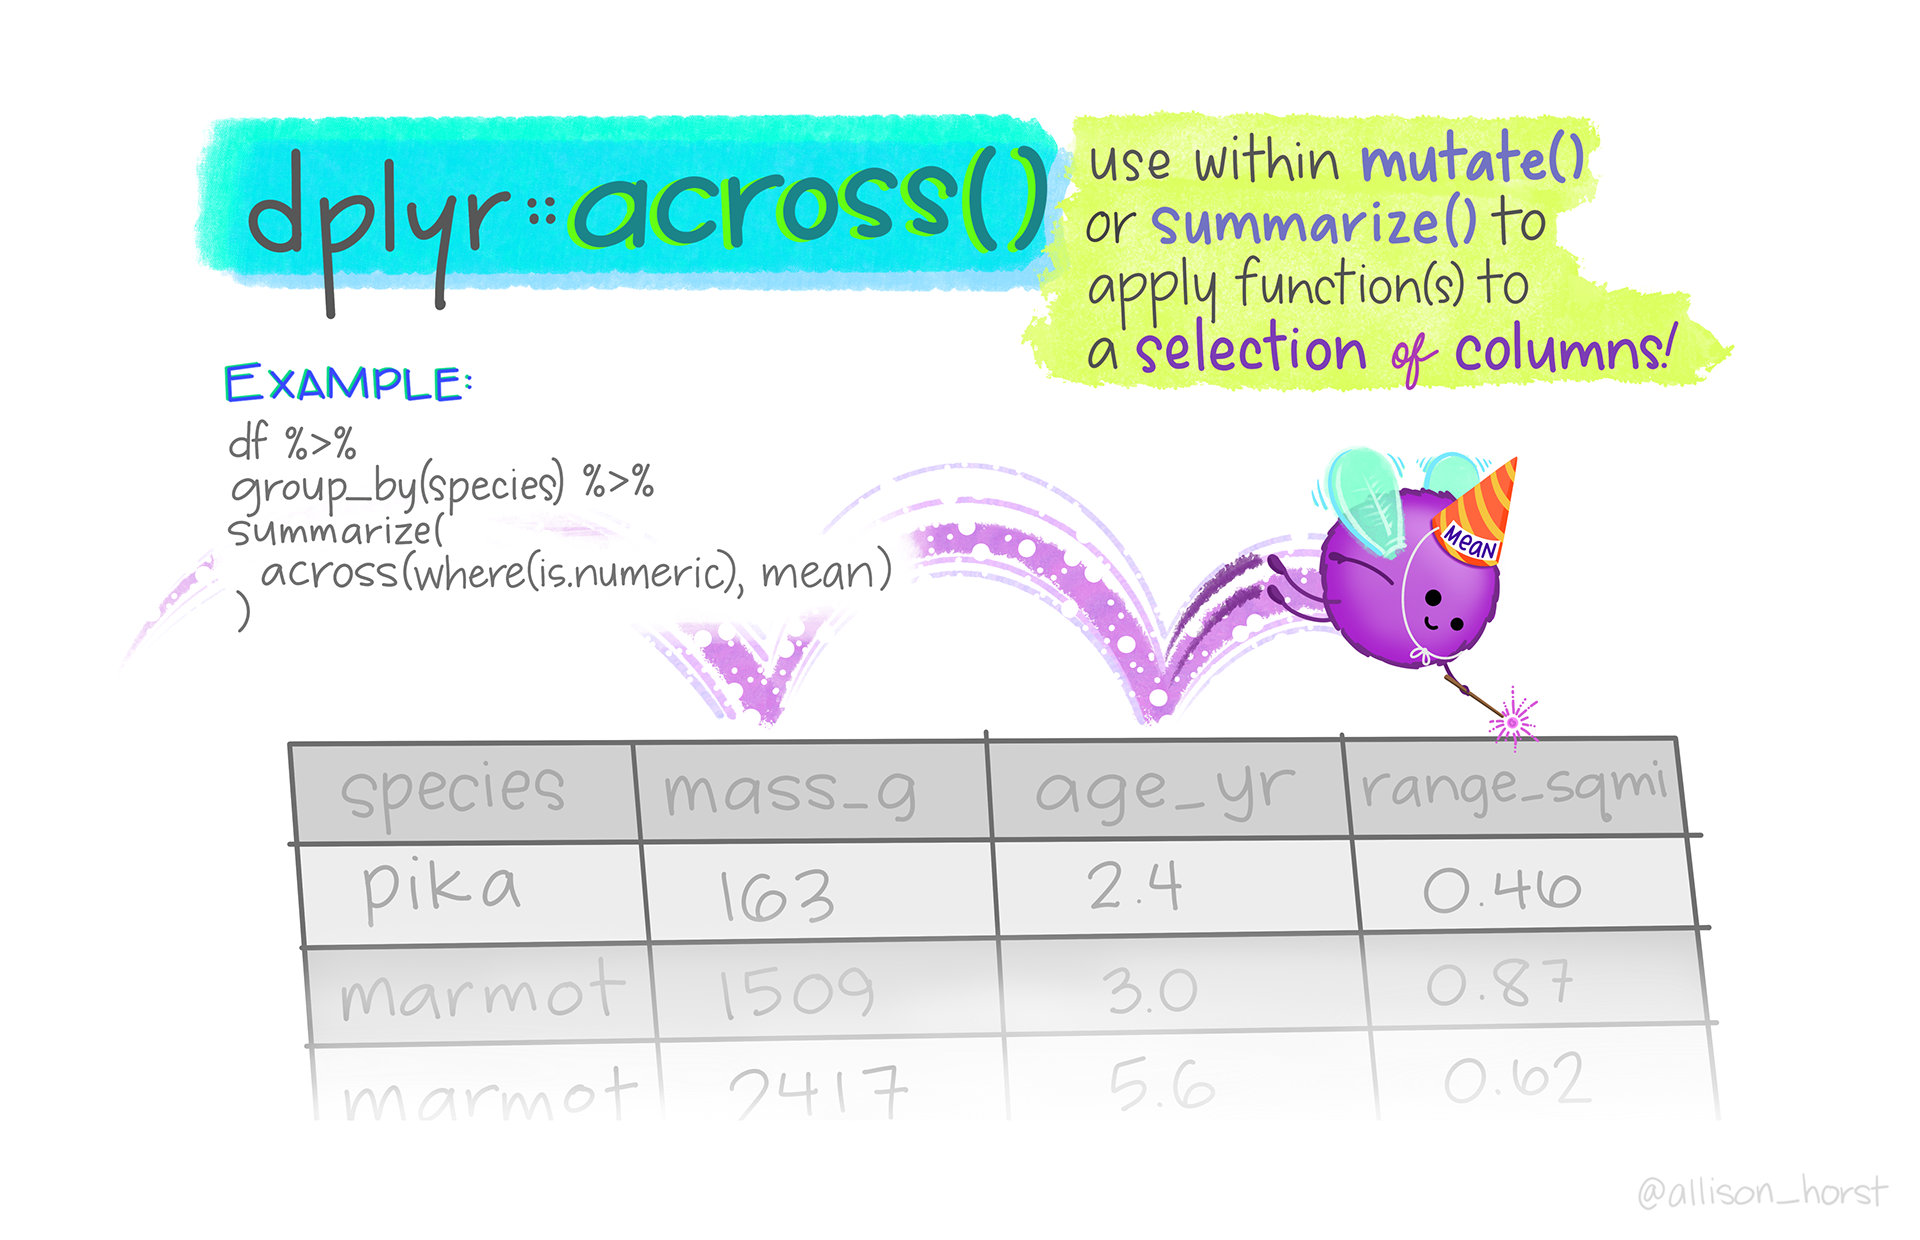
Image credit: @allison_horst
Summarizing columns iteratively
Side note on functional programming
A programming paradigm where programs are constructed by applying and composing functions
- We can pass a function,
sd_errortoacross()since R is a functional programming language - We are not calling
sd_error() - Instead we pass
sd_errorsoacross()can call it - Thus function name is not followed by
()
across() + selector helpers
# A tibble: 1 × 2
  bill_length_mm bill_depth_mm
           <dbl>         <dbl>
1 0.295 0.107Selection helpers
starts_with(): Starts with a prefixends_with(): Ends with a suffixcontains(): Contains a literal stringnum_range(): Matches a numerical range like x01, x02, x03one_of(): Matches variable names in a character vectoreverything(): Matches all variableslast_col(): Select last variable, possibly with an offsetmatches(): Matches a regular expression (a sequence of symbols/characters expressing a string/pattern to be searched for within text)c_across(): Use a tidy selector within a non-selecting function (e.g.sum())
Implementing anonymous functions
- In-line functions
- Lambda functions
Count number of missing values per column
Multiple summarize operations
penguins |>
  drop_na() |>
  summarize(
    across(
      .cols = where(is.numeric),
      .fns = list(mean = mean, sd = sd),
      .names = "{.fn}_{.col}"
    )
  )
# A tibble: 1 × 10
mean_bill_length_mm sd_bill_length_mm mean_bill_depth_mm sd_bill_depth_mm
<dbl> <dbl> <dbl> <dbl>
1 44.0 5.47 17.2 1.97
# ℹ 6 more variables: mean_flipper_length_mm <dbl>, sd_flipper_length_mm <dbl>,
# mean_body_mass_g <dbl>, sd_body_mass_g <dbl>, mean_year <dbl>,
# sd_year <dbl>Bring back anonymous functions
penguins |>
  summarize(
    across(
      .cols = where(is.numeric),
      .fns = list(
        mean = \(x) mean(x, na.rm = TRUE),
        sd = \(x) sd(x, na.rm = TRUE)
      ),
      .names = "{.fn}_{.col}"
    )
  )
# A tibble: 1 × 10
mean_bill_length_mm sd_bill_length_mm mean_bill_depth_mm sd_bill_depth_mm
<dbl> <dbl> <dbl> <dbl>
1 43.9 5.46 17.2 1.97
# ℹ 6 more variables: mean_flipper_length_mm <dbl>, sd_flipper_length_mm <dbl>,
# mean_body_mass_g <dbl>, sd_body_mass_g <dbl>, mean_year <dbl>,
# sd_year <dbl>Do it within groups
penguins |>
  group_by(species) |>
  summarize(
    across(
      .cols = where(is.numeric),
      .fns = list(
        mean = \(x) mean(x, na.rm = TRUE),
        sd = \(x) sd(x, na.rm = TRUE)
      ),
      .names = "{.fn}_{.col}"
    )
  )
# A tibble: 3 × 11
species mean_bill_length_mm sd_bill_length_mm mean_bill_depth_mm
<fct> <dbl> <dbl> <dbl>
1 Adelie 38.8 2.66 18.3
2 Chinstrap 48.8 3.34 18.4
3 Gentoo 47.5 3.08 15.0
# ℹ 7 more variables: sd_bill_depth_mm <dbl>, mean_flipper_length_mm <dbl>,
# sd_flipper_length_mm <dbl>, mean_body_mass_g <dbl>, sd_body_mass_g <dbl>,
# mean_year <dbl>, sd_year <dbl>Modify columns
# A tibble: 344 × 8
   species island    bill_length_mm bill_depth_mm flipper_length_mm body_mass_g
   <fct>   <fct>              <dbl>         <dbl>             <dbl>       <int>
 1 Adelie  Torgersen         -0.883         0.784            -1.42         3750
 2 Adelie  Torgersen         -0.810         0.126            -1.06         3800
 3 Adelie  Torgersen         -0.663         0.430            -0.421        3250
 4 Adelie  Torgersen         NA            NA                NA              NA
 5 Adelie  Torgersen         -1.32          1.09             -0.563        3450
 6 Adelie  Torgersen         -0.847         1.75             -0.776        3650
 7 Adelie  Torgersen         -0.920         0.329            -1.42         3625
 8 Adelie  Torgersen         -0.865         1.24             -0.421        4675
 9 Adelie  Torgersen         -1.80          0.480            -0.563        3475
10 Adelie  Torgersen         -0.352         1.54             -0.776        4250
# ℹ 334 more rows
# ℹ 2 more variables: sex <fct>, year <int>
Rename output columns
penguins |>
  mutate(across(
    .cols = ends_with("mm"),
    .fns = \(x) scale(x) |> as.numeric(),
    .names = "{.col}_sc"
  )) |>
  select(contains("mm"))
# A tibble: 344 × 6
bill_length_mm bill_depth_mm flipper_length_mm bill_length_mm_sc
<dbl> <dbl> <int> <dbl>
1 39.1 18.7 181 -0.883
2 39.5 17.4 186 -0.810
3 40.3 18 195 -0.663
4 NA NA NA NA
5 36.7 19.3 193 -1.32
6 39.3 20.6 190 -0.847
7 38.9 17.8 181 -0.920
8 39.2 19.6 195 -0.865
9 34.1 18.1 193 -1.80
10 42 20.2 190 -0.352
# ℹ 334 more rows
# ℹ 2 more variables: bill_depth_mm_sc <dbl>, flipper_length_mm_sc <dbl>across() not always needed
# A tibble: 344 × 5
   bill_length_mm bill_depth_mm flipper_length_mm body_mass_g  year
            <dbl>         <dbl>             <int>       <int> <int>
 1           39.1          18.7               181        3750  2007
 2           39.5          17.4               186        3800  2007
 3           40.3          18                 195        3250  2007
 4           NA            NA                  NA          NA  2007
 5           36.7          19.3               193        3450  2007
 6           39.3          20.6               190        3650  2007
 7           38.9          17.8               181        3625  2007
 8           39.2          19.6               195        4675  2007
 9           34.1          18.1               193        3475  2007
10           42            20.2               190        4250  2007
# ℹ 334 more rowsApplication exercise
ae-11
Instructions
- Go to the course GitHub org and find your
ae-11(repo name will be suffixed with your GitHub name). - Clone the repo in RStudio, run
renv::restore()to install the required packages, open the Quarto document in the repo, and follow along and complete the exercises. - Render, commit, and push your edits by the AE deadline – end of the day
ae-11 - Part 1
Instructions
Write a function that summarizes multiple specified columns of a data frame and calculates their arithmetic mean and standard deviation.
10:00
Atomic vectors
Types of vectors
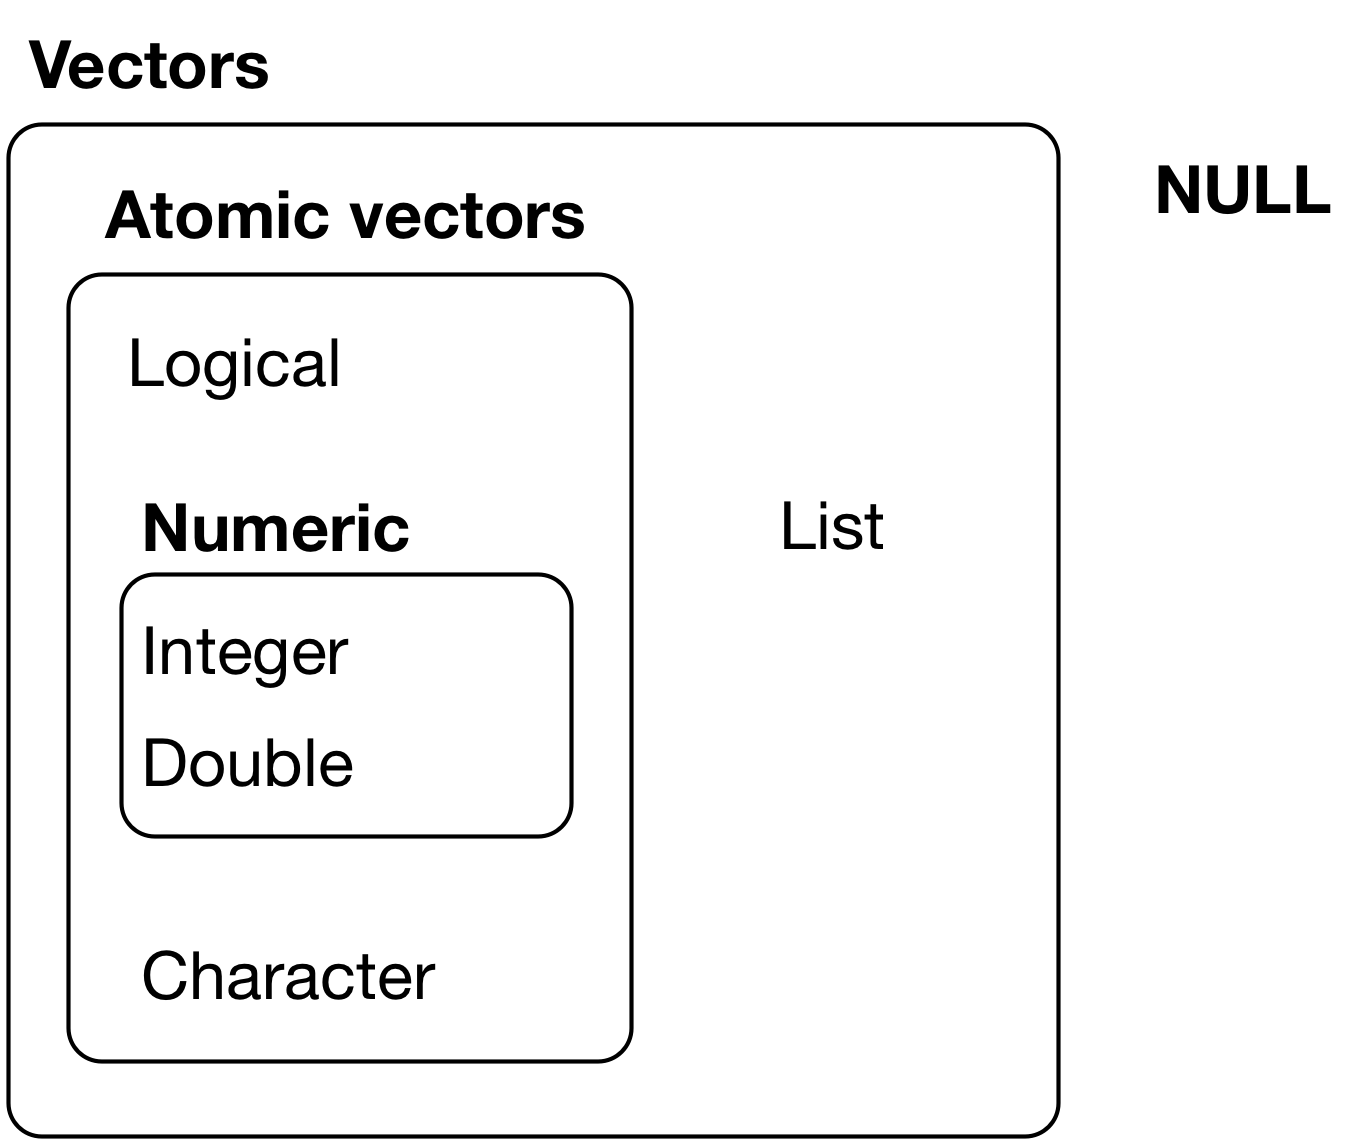
Image credit: R for Data Science (1st ed)
Lists
Lists: str()
Store a mix of objects
Nested lists
Secret lists
tibble [125 × 14] (S3: tbl_df/tbl/data.frame)
 $ case                : chr [1:125] "Oxford High School shooting" "San Jose VTA shooting" "FedEx warehouse shooting" "Orange office complex shooting" ...
 $ year                : num [1:125] 2021 2021 2021 2021 2021 ...
 $ month               : chr [1:125] "Nov" "May" "Apr" "Mar" ...
 $ day                 : int [1:125] 30 26 15 31 22 16 16 26 10 6 ...
 $ location            : chr [1:125] "Oxford, Michigan" "San Jose, California" "Indianapolis, Indiana" "Orange, California" ...
 $ summary             : chr [1:125] "Ethan Crumbley, a 15-year-old student at Oxford High School, opened fire with a Sig Sauer 9mm pistol purchased "| __truncated__ "Samuel Cassidy, 57, a Valley Transportation Authorty employee, opened fire at a union meeting at the light rail"| __truncated__ "Brandon Scott Hole, 19, opened fire around 11 p.m. in the parking lot and inside the warehouse, and then shot h"| __truncated__ "Aminadab Gaxiola Gonzalez, 44, allegedly opened fire inside a small business at an office complex, killing at l"| __truncated__ ...
 $ fatalities          : num [1:125] 4 9 8 4 10 8 4 5 4 3 ...
 $ injured             : num [1:125] 7 0 7 1 0 1 0 0 3 8 ...
 $ total_victims       : num [1:125] 11 9 15 5 10 9 4 5 7 11 ...
 $ location_type       : chr [1:125] "School" "Workplace" "Workplace" "Workplace" ...
 $ male                : logi [1:125] TRUE TRUE TRUE TRUE TRUE TRUE ...
 $ age_of_shooter      : num [1:125] 15 57 19 NA 21 21 31 51 NA NA ...
 $ race                : chr [1:125] NA NA "White" NA ...
 $ prior_mental_illness: chr [1:125] NA "Yes" "Yes" NA ...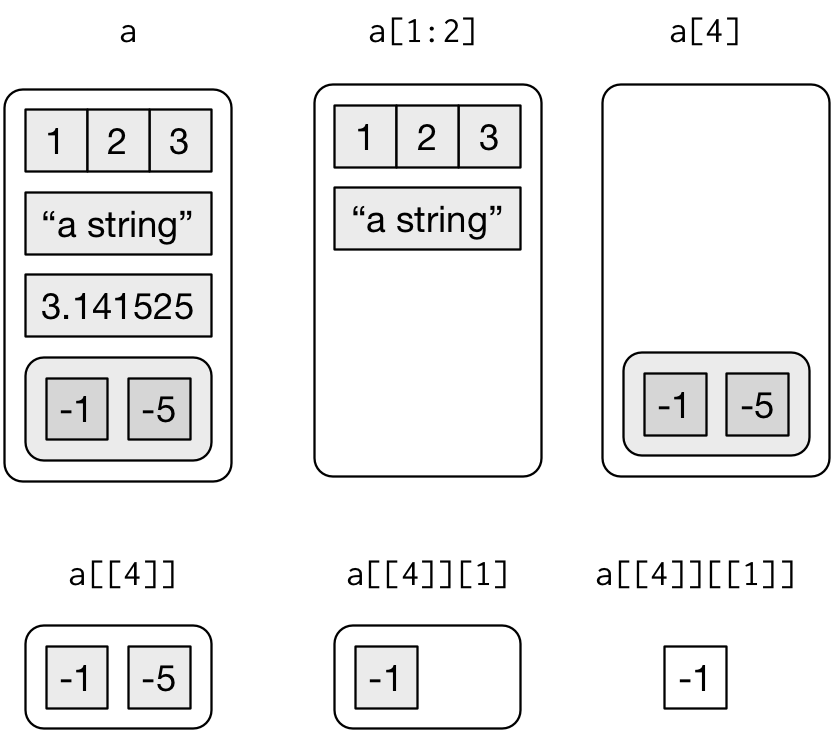
Image credit: R for Data Science (1st ed)
Iteration with {purrr}
Map functions
Apply a function to each element of a list or vector, and return a *.
map()makes a listmap_lgl()makes a logical vectormap_int()makes an integer vectormap_dbl()makes a double vectormap_chr()makes a character vector
Map functions
Map functions
          a           b           c           d
0.07462564 0.20862196 -0.42455887 0.32204455 Application exercise
ae-11 - Part 2
Instructions
- Write a function that scrapes the content from a single listing page of articles published on The Cornell Review
- Apply the function to the most recent 10 pages of articles
- Create a single CSV file containing information on the 100 most recent published articles
Wrap up
Recap
- Iteration across columns can be performed using
across() - Make use of lambda/anonymous functions to perform one-off operations
map()functions are a family of functions that apply a function to each element of a vector or list