Application Programming Interfaces
Lecture 13
Dr. Benjamin Soltoff
Cornell University
INFO 2951 - Spring 2026
March 5, 2026
Announcements
Announcements
- Homework 05
- Project proposals for discussion sections tomorrow
Learning objectives
- Define application program interfaces (APIs)
- Explain authentication keys and demonstrate secure methods for storing these keys
- Demonstrate how to use canned packages in R to access APIs
- Identify methods for writing functions to interact with APIs
- Access APIs directly using the {httr2} package
Reading data into R
- Local data files
- Databases
- Web scraping
- Application programming interfaces (APIs)
Application programming interface (API)
A set of rules and protocols for exchanging information between software applications
- Representational State Transfer (REST)
- Uniform Resource Location (URL)
- HTTP methods
- GET
- POST
RESTful queries
- Submit request to server via URL
- Return result in a structured format
- Parse results into a local format
Install and play packages
Packages with R functions written for existing APIs
Useful because
- Reproducible
- Ease of access
- Much easier to keep track of revisions and updates
- Scales to a far larger userbase
API authentication
How to verify that a user or device has permission to access an API?
Different methods include:
- Username/password (out of favor)
- Keys (e.g. GitHub and {usethis})
- OAuth tokens (e.g. what {googlesheets4} tried to do)
API keys
- Random string of alphanumeric characters unique to a device (and possibly a user)
- Access restrictions based on needs
- Obtain key
- Store key securely
Never store directly in an visible R script or Quarto document
Store in .Rprofile or .Renviron and exclude these files from a public Git repo
Storing API keys
Census data with {tidycensus}
Census data with {tidycensus}
- API to access data from US Census Bureau
- Decennial census
- American Community Survey
- Returns tidy data frames with (optional) {sf} geometry
- Search for variables with
load_variables()
Store API key
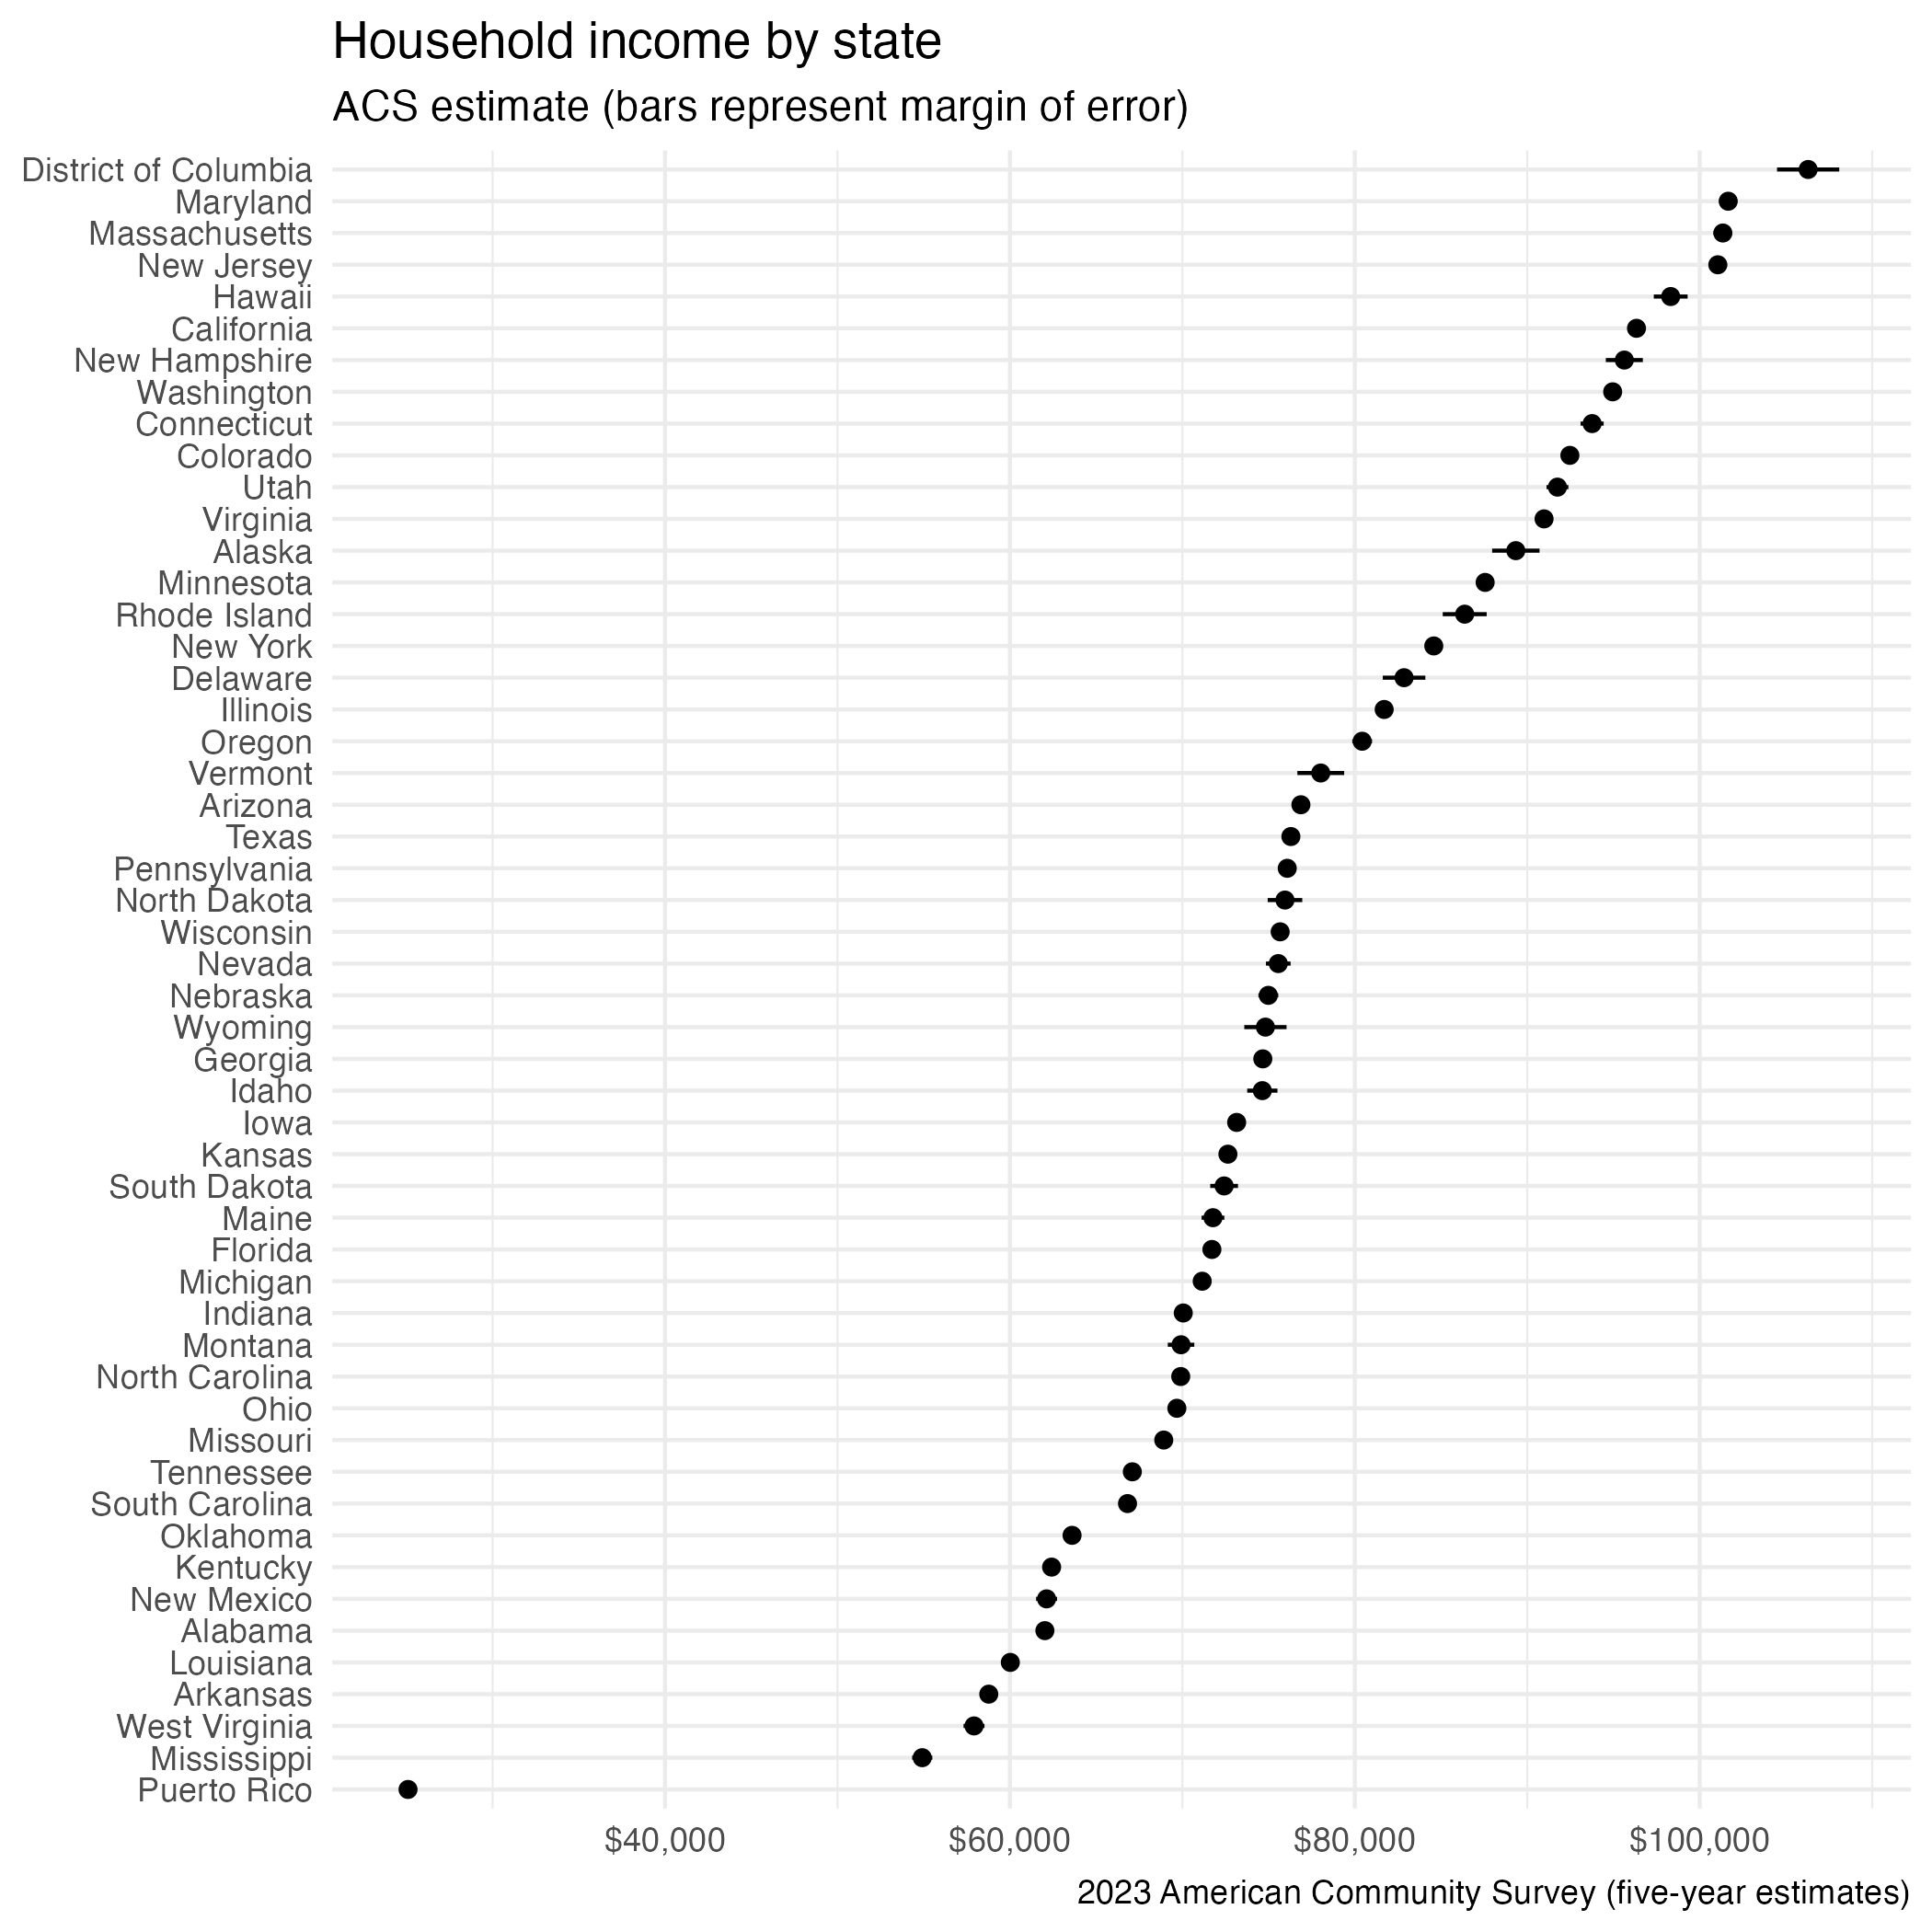
Obtain data
# A tibble: 52 × 5
   GEOID NAME                 variable  estimate   moe
   <chr> <chr>                <chr>        <dbl> <dbl>
 1 01    Alabama              medincome    63999   399
 2 02    Alaska               medincome    92788  1232
 3 04    Arizona              medincome    79964   407
 4 05    Arkansas             medincome    60773   467
 5 06    California           medincome    99122   310
 6 08    Colorado             medincome    95470   578
 7 09    Connecticut          medincome    95781   732
 8 10    Delaware             medincome    84954  1251
 9 11    District of Columbia medincome   109870  1937
10 12    Florida              medincome    74568   284
# ℹ 42 more rows
Visualize data
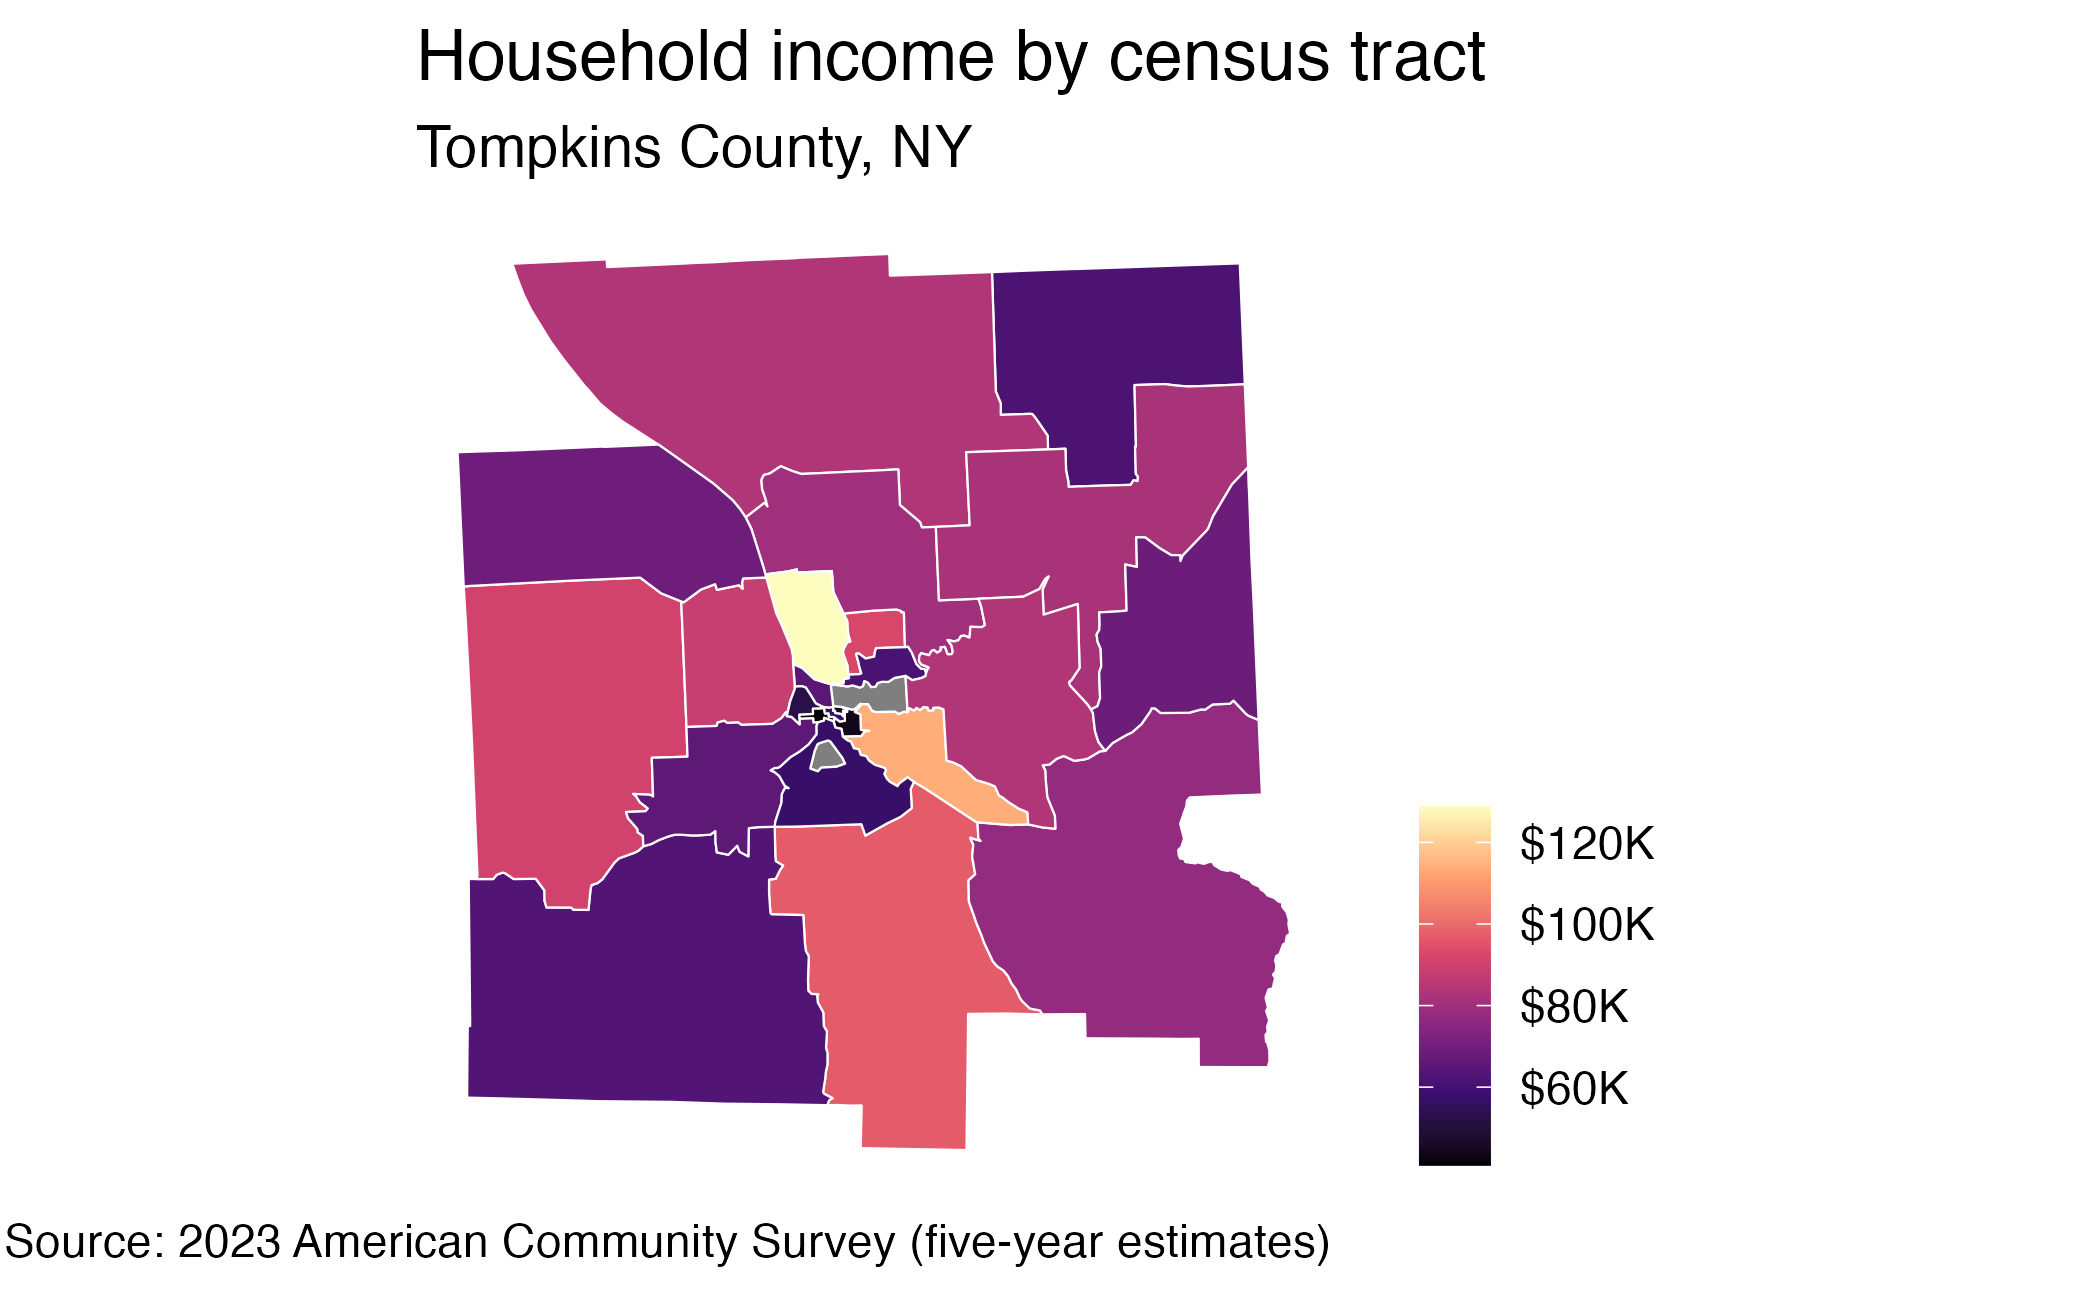
Obtain geometry with {tidycensus}
Simple feature geometry with {sf}
Simple feature collection with 65 features and 5 fields
Geometry type: MULTIPOLYGON
Dimension:     XY
Bounding box:  xmin: -76.69666 ymin: 42.26298 xmax: -76.23782 ymax: 42.62742
Geodetic CRS:  NAD83
First 10 features:
          GEOID                                                         NAME  variable estimate
1  361090010003    Block Group 3; Census Tract 10; Tompkins County; New York medincome    57688
2  361090002011  Block Group 1; Census Tract 2.01; Tompkins County; New York medincome    41611
3  361090013021 Block Group 1; Census Tract 13.02; Tompkins County; New York medincome   128438
4  361090013022 Block Group 2; Census Tract 13.02; Tompkins County; New York medincome    83750
5  361090012001    Block Group 1; Census Tract 12; Tompkins County; New York medincome       NA
6  361090020003    Block Group 3; Census Tract 20; Tompkins County; New York medincome    93017
7  361090001001     Block Group 1; Census Tract 1; Tompkins County; New York medincome    43214
8  361090006004     Block Group 4; Census Tract 6; Tompkins County; New York medincome   239007
9  361090008002     Block Group 2; Census Tract 8; Tompkins County; New York medincome    66603
10 361090006001     Block Group 1; Census Tract 6; Tompkins County; New York medincome   172587
      moe                       geometry
1   55244 MULTIPOLYGON (((-76.5083 42...
2   16121 MULTIPOLYGON (((-76.48865 4...
3   25966 MULTIPOLYGON (((-76.48434 4...
4   77696 MULTIPOLYGON (((-76.4747 42...
5      NA MULTIPOLYGON (((-76.49984 4...
6   21648 MULTIPOLYGON (((-76.3476 42...
7    4430 MULTIPOLYGON (((-76.49911 4...
8  130001 MULTIPOLYGON (((-76.52701 4...
9   17509 MULTIPOLYGON (((-76.50861 4...
10  62560 MULTIPOLYGON (((-76.49915 4...
Visualize geometry
Generative AI models with {ellmer}
{ellmer}
Store your API key in .Renviron as ANTHROPIC_API_KEY
R is useful for several key reasons:

**Statistical analysis** - Built specifically for statistics with extensive built-in functions for
virtually any statistical test or model

**Data visualization** - ggplot2 and other packages create publication-quality graphs with minimal
code

**Data manipulation** - Tools like dplyr and data.table make cleaning and transforming data
intuitive

**Reproducible research** - R Markdown integrates code, results, and documentation seamlessly

**Free and open source** - No licensing costs, with a massive repository (CRAN) of 19,000+ packages

**Active community** - Strong support from statisticians, data scientists, and academics

**Domain-specific tools** - Excellent packages for bioinformatics, econometrics, psychometrics, and
other specialized fields

It's especially popular in academia, biotech, finance, and anywhere statistical rigor is paramount.
Application exercise
Writing an API function
- Open Movie Database
- No R package for API
- Write your own function with {httr2}
ae-11
Instructions
- Go to the course GitHub org and find your
ae-11(repo name will be suffixed with your GitHub name). - Clone the repo in Positron, run
renv::restore()to install the required packages, open the Quarto document in the repo, and follow along and complete the exercises. - Render, commit, and push your edits by the AE deadline – end of the day
Wrap up
Recap
- APIs offer a set of structured HTTP requests that return JSON or XML files
- Use pre-written packages in R to access APIs when available
- Use {httr2} to write your own API functions
- Store API keys securely in
.Rprofileor.Renviron