Working with relational data
Lecture 05
February 3, 2026

inner_join()
inner_join(x = superheroes, y = publishers, by = join_by(Publisher))
left_join()
left_join(x = superheroes, y = publishers, by = join_by(Publisher))

right_join()
right_join(x = superheroes, y = publishers, by = join_by(Publisher))

right_join() reversed
left_join(x = publishers, y = superheroes, by = join_by(Publisher))
full_join()
full_join(x = superheroes, y = publishers, by = join_by(Publisher))
semi_join()
semi_join(x = superheroes, y = publishers, by = join_by(Publisher))

anti_join()
anti_join(x = superheroes, y = publishers, by = join_by(Publisher))


Goal
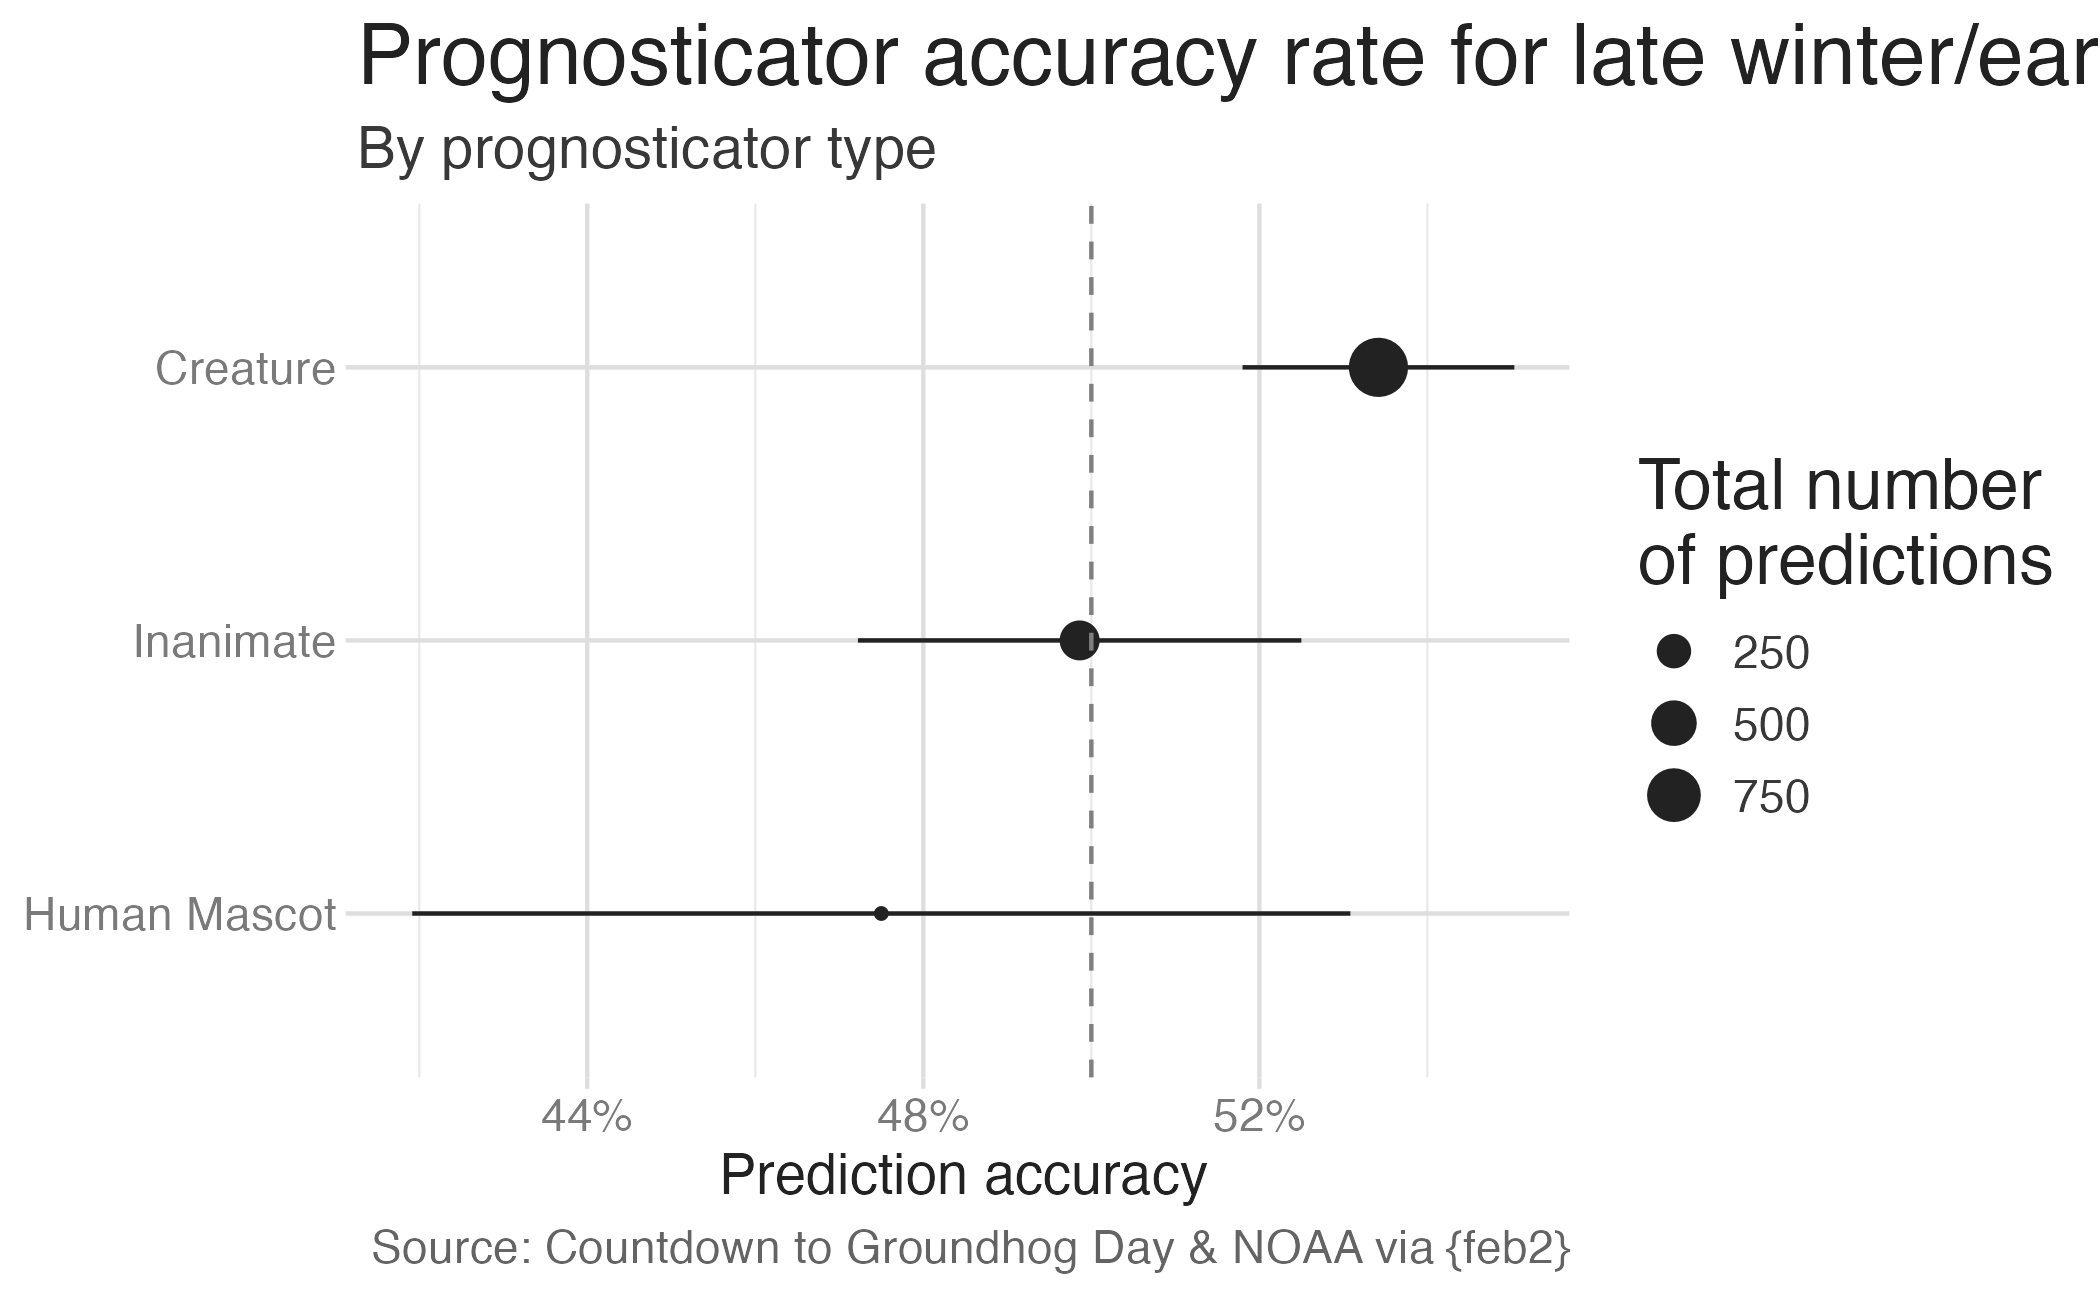
TidyTuesday
![]()